if(!require(remotes)) install.packages("remotes")
library(remotes)
if (!requireNamespace("rnmodel", quietly = TRUE)) {
  remotes::install_github("agronomy4future/rnmodel", force= TRUE)
}
library(rnmodel)

if(!require(readr)) install.packages("readr")
library(readr)

github= paste0("https://raw.githubusercontent.com/agronomy4future/",
                "raw_data_practice/refs/heads/main/",
                "nitrogen_level_crop_yield.csv")
df= data.frame(read_csv(url(github),show_col_types = FALSE))

output= rnmodel(data= df, genotype_by= c("Genotype","Replicate"),
                environment="Nitrogen_Level",
                response="Yield",
                env_numeric = NULL)

result=output$reaction_norm

set.seed(100)
print(result[sample(nrow(result),5),])

Reaction Norm Model Output (Biological Terms):

     Genotype Replicate baseline plasticity baseline_se plasticity_se
503       CV2         3  3.22400  0.0063072   0.3199945   0.002612744
2035      CV5        35  2.95600  0.0193400   0.3123171   0.002550059
470       CV1       470  3.31600 -0.0008200   0.1552482   0.001267596
1990      CV4       490  3.96964  0.0041024   0.3560298   0.002906971
1540      CV4        40  3.50714  0.0057524   0.4093860   0.003342623
Fig1=ggplot(data=result, aes(x=Genotype, y=plasticity, fill=Genotype)) +
  geom_boxplot() +
  scale_color_manual(values=c("cadetblue","darkorchid4","orange3",
  "skyblue4","wheat4"))+
  scale_fill_manual(values=c("cadetblue","darkorchid4","orange3",
  "skyblue4","wheat4"))+
  labs(x="Genotype", y="Plascitiy (slope)") +
  theme_classic(base_size=15, base_family="serif") +
  theme(legend.position="none",
        legend.title=element_blank(),
        legend.key=element_rect(color="white", fill=alpha(0.5)),
        legend.text=element_text(family="serif", face="plain",
        size=13, color="black"),
        legend.background= element_rect(fill=alpha(0.5)),
        axis.title.y = element_text(margin= margin(r= 15)),
        panel.border= element_rect(color="black", fill=NA, linewidth=0.5),
        axis.line= element_line(linewidth=0.5, colour="black"),
        strip.background=element_rect(color="white",
        linewidth=0.5, linetype="solid"))

options(repr.plot.width=5.5, repr.plot.height=5)
print(Fig1)

ggsave("Fig1.png", plot= Fig1, width=5.5, height= 5, dpi= 300)
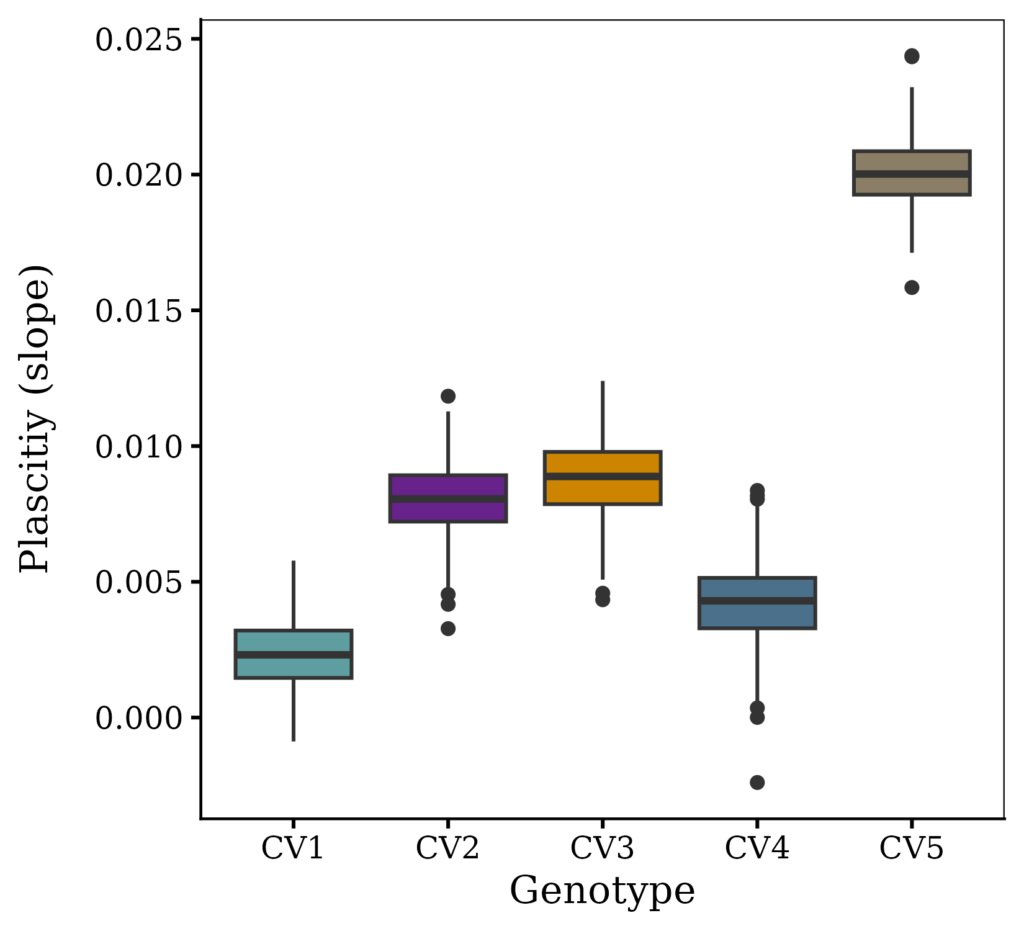
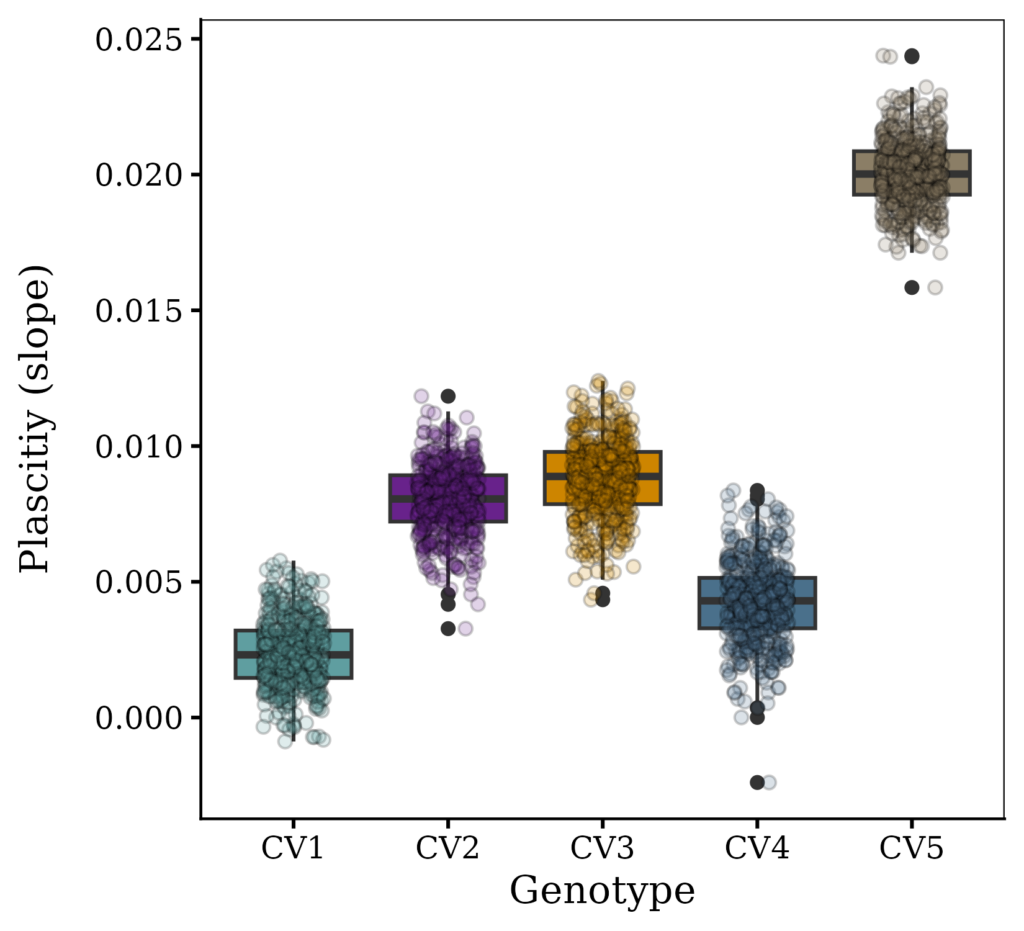
Fig1=ggplot(data=result, aes(x=Genotype, y=plasticity, fill=Genotype)) +
  geom_boxplot() +
  geom_jitter(data=result, aes(x= Genotype, y= plasticity,
  fill=Genotype, shape=Genotype), width=0.2, alpha=0.2, size=2) +
  scale_color_manual(values=c("cadetblue","darkorchid4","orange3",
  "skyblue4","wheat4"))+
  scale_fill_manual(values=c("cadetblue","darkorchid4","orange3",
  "skyblue4","wheat4"))+
  scale_shape_manual(values=c(21,21,21,21,21))+
  labs(x="Genotype", y="Plascitiy (slope)") +
  theme_classic(base_size=15, base_family="serif") +
  theme(legend.position="none",
        legend.title=element_blank(),
        legend.key=element_rect(color="white", fill=alpha(0.5)),
        legend.text=element_text(family="serif", face="plain",
        size=13, color="black"),
        legend.background= element_rect(fill=alpha(0.5)),
        axis.title.y = element_text(margin= margin(r= 15)),
        panel.border= element_rect(color="black", fill=NA, linewidth=0.5),
        axis.line= element_line(linewidth=0.5, colour="black"),
        strip.background=element_rect(color="white",
        linewidth=0.5, linetype="solid"))

options(repr.plot.width=5.5, repr.plot.height=5)
print(Fig2)

ggsave("Fig2.png", plot= Fig2, width=5.5, height= 5, dpi= 300)
We aim to develop open-source code for agronomy ([email protected])
© 2022 – 2025 https://agronomy4future.com – All Rights Reserved.
Last Updated: 11/07/2023