I will randomly create a piece of data and then proceed to plot a line graph with points for this data.
Genotype= rep(c("GenotypeA","GenotypeB"),each=6)
Nitrogen= rep(c(0,20,50,100,150,200),2)
Yield= c(25,27,26,27,30,35,10,12,14,16,18,20)
dataA= data.frame(Genotype,Nitrogen,Yield)
print(head(dataA, 5))
    Genotype Nitrogen Yield
1  GenotypeA        0    25
2  GenotypeA       20    27
3  GenotypeA       50    26
4  GenotypeA      100    27
5  GenotypeA      150    30
.
.
.
if(!require(ggplot2)) install.packages("ggplot2")
library(ggplot2)

ggplot(data=dataA, aes(x=Nitrogen, y=Yield, fill=Genotype,
  shape=Genotype))+
  geom_line(size=1, linetype="dashed") +
  geom_point(size=5) +
  scale_shape_manual(values= c(21,22)) +
  scale_fill_manual(values= c("White", "Orange")) +
  scale_x_continuous(breaks = seq(0,200,50),limits = c(0,200)) +
  scale_y_continuous(breaks = seq(0,40,5),limits = c(0,40)) +
  labs(x="Nitrogen", y="Yield") +
  theme_classic(base_size=18, base_family="serif")+
  theme(legend.position='bottom',
        legend.title=element_blank(),
        legend.key=element_rect(color="white", fill="white"),
        legend.text=element_text(family="serif", face="plain",
                                 size=15, color= "Black"),
        legend.background=element_rect(fill="white"),
        axis.line=element_line(linewidth=0.5, colour="black"))
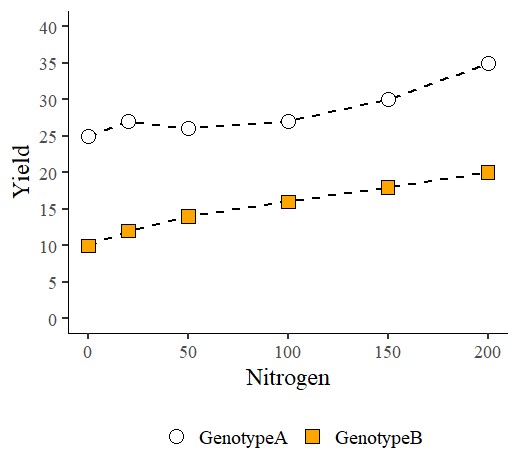
I have differentiated point colors and shapes based on the variable “Genotype”. In the above code, the value geom_point(size=5) sets the point size to 5 for both GenotypeA and GenotypeB. However, I would like to increase the point size specifically for GenotypeA.
if(!require(ggplot2)) install.packages("ggplot2")
library(ggplot2)

ggplot(data=dataA, aes(x=Nitrogen, y=Yield, fill=Genotype,
  shape=Genotype))+
  geom_line(size=1, linetype="dashed") +
  geom_point(aes(size=Genotype)) +
  scale_shape_manual(values= c(21,22)) +
  scale_fill_manual(values= c("White", "Orange")) +
  scale_size_manual(values=c(9,6))+
  scale_x_continuous(breaks = seq(0,200,50),limits = c(0,200)) +
  scale_y_continuous(breaks = seq(0,40,5),limits = c(0,40)) +
  labs(x="Nitrogen", y="Yield") +
  theme_classic(base_size=18, base_family="serif")+
  theme(legend.position='bottom',
        legend.title=element_blank(),
        legend.key=element_rect(color="white", fill="white"),
        legend.text=element_text(family="serif", face="plain",
        size=15, color= "black"),
        legend.background=element_rect(fill="white"),
        axis.line=element_line(linewidth=0.5, colour="black"))
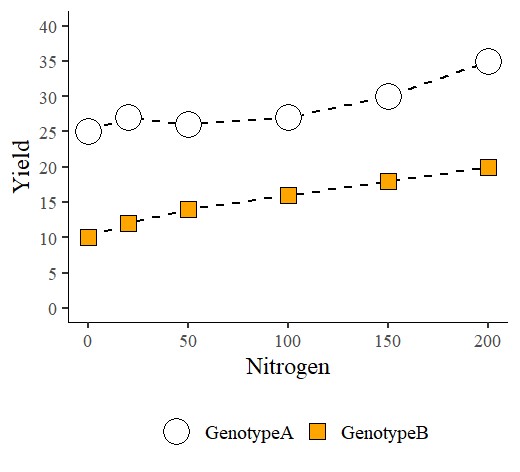
I will change the code from geom_point(size=5) to geom_point(aes(size=Genotype)). This means that I will adjust the point size based on the variable “Genotype”. Additionally, I will use scale_size_manual(values=c(9,6)) to set the point size differently. Specifically, I will set the point size for GenotypeA to 9 and for GenotypeB to 6.

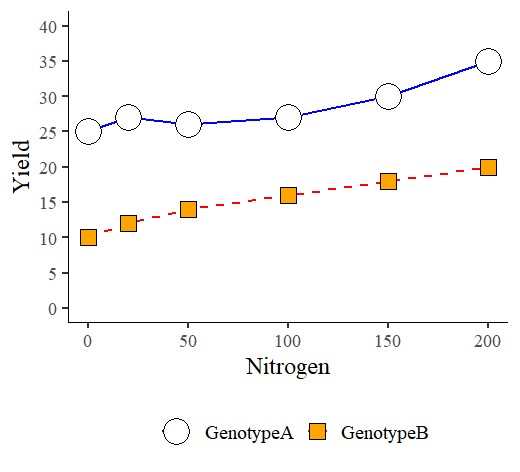
Now, I would like to adjust the lines. Since the code geom_line(size=1, linetype="dashed") was provided, both GenotypeA and GenotypeB currently have a line size of 1 and a dashed line type. I would like to set a solid blue line for GenotypeA and a red dashed line for GenotypeB.
if(!require(ggplot2)) install.packages("ggplot2")
library(ggplot2)

ggplot(data=dataA, aes(x=Nitrogen, y=Yield, fill=Genotype,
  shape=Genotype))+
  geom_line(aes(linetype= Genotype, color=Genotype), size=1) +
  geom_point(aes(size=Genotype)) +
  scale_shape_manual(values= c(21,22)) +
  scale_fill_manual(values= c("White", "Orange")) +
  scale_size_manual(values=c(9,6))+
  scale_color_manual(values=c("Blue","Red")) +
  scale_linetype_manual(values=c("solid","dashed")) +
  scale_x_continuous(breaks = seq(0,200,50),limits = c(0,200)) +
  scale_y_continuous(breaks = seq(0,40,5),limits = c(0,40)) +
  labs(x="Nitrogen", y="Yield") +
  theme_classic(base_size=18, base_family="serif")+
  theme(legend.position='bottom',
        legend.title=element_blank(),
        legend.key=element_rect(color="white", fill="white"),
        legend.text=element_text(family="serif", face="plain",
        size=15, color= "Black"),
        legend.background=element_rect(fill="white"),
        axis.line=element_line(linewidth=0.5, colour="black"))
I will update the code from geom_line(size=1, linetype="dashed") to geom_line(aes(linetype=Genotype, color=Genotype), size=1). Now that I’ve added aes() with linetype and color set to Genotype, I can configure linetypes and colors based on the different Genotypes. I will utilize scale_color_manual() and scale_linetype_manual() for this purpose.
If you want to specify line sizes separately, you can include size within aes() in the geom_line. It would look like geom_line(aes(linetype=Genotype, color=Genotype, size=Genotype)). However, this approach brings about an issue: the scale_size_manual(values=c(9,6)) code you used to set point sizes will also affect line sizes in the same way.
liif(!require(ggplot2)) install.packages("ggplot2")
library(ggplot2)

ggplot(data=dataA, aes(x=Nitrogen, y=Yield, fill=Genotype,
  shape=Genotype))+
  geom_line(aes(linetype= Genotype, color=Genotype,
  size=Genotype)) +
  geom_point(aes(size=Genotype)) +
  scale_shape_manual(values= c(21,22)) +
  scale_fill_manual(values= c("White", "Orange")) +
  scale_size_manual(values=c(9,6))+
  scale_color_manual(values=c("Blue","Red"))+
  scale_linetype_manual(values=c("solid","dashed")) +
  scale_x_continuous(breaks = seq(0,200,50),limits = c(0,200)) +
  scale_y_continuous(breaks = seq(0,40,5),limits = c(0,40)) +
  labs(x="Nitrogen", y="Yield") +
  theme_classic(base_size=18, base_family="serif")+
  theme(legend.position='bottom',
        legend.title=element_blank(),
        legend.key=element_rect(color="white", fill="white"),
        legend.text=element_text(family="serif", face="plain",
        size=15, color= "Black"),
        legend.background=element_rect(fill="white"),
        axis.line=element_line(linewidth=0.5, colour="black"))
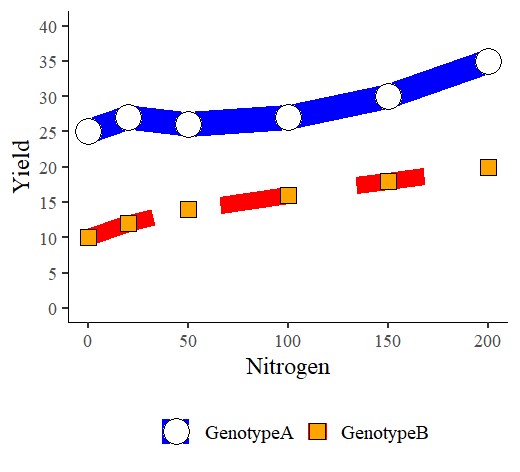
Indeed, if you want to maintain a consistent line size and differentiate it from point sizes, it’s more convenient to keep the line size specification outside of the aes(). However, if it’s necessary to create variations in line sizes based on the variable, I would need to find the relevant code.