Recently, I saw the QS World University Rankings; QS World University Rankings by Subject 2024: Agriculture & Forestry. It shows the global university rankings for Agriculture and Forestry Science. Suddenly, I became interested in marking the U.S. agriculture universities on a map to see where these colleges are located in the U.S. I found that the Folium package in Python provides an excellent GIS map with an easy process, and I am sharing the code here.
First, using Python, I’ll upload a list of U.S. colleges ranked among the top global universities for Agriculture and Forestry Science in 2024 from my GitHub. I am using Google Colab.
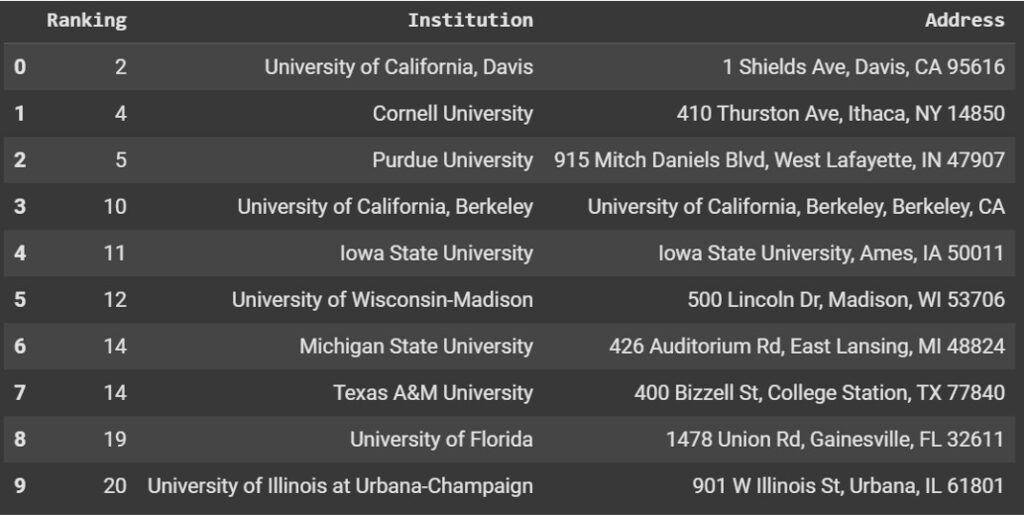
import pandas as pd
import requests
from io import StringIO

github="https://raw.githubusercontent.com/agronomy4future/raw_data_practice/refs/heads/main/US_AGRICULTURE_COLLEGE_LIST.csv"
response=requests.get(github)
df=pd.read_csv(StringIO(response.text))

df.head(10)
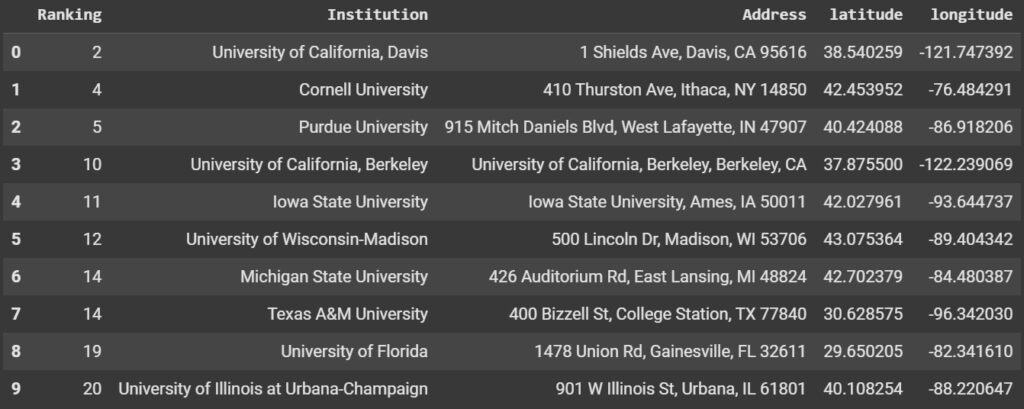
I’ll add coordinates (latitude and longitude) to this data.
from geopy.geocoders import Nominatim
import time

geolocator = Nominatim(user_agent="geoapi")

def get_lat_lon(Address):
    try:
        location = geolocator.geocode(Address)
        return location.latitude, location.longitude
    except:
        return None, None

df[['latitude', 'longitude']] = df['Address'].apply(lambda x: pd.Series(get_lat_lon(x)))
df.head(10)
I’ll download this data to check if all the coordinates were generated correctly.
df.to_csv('df.csv', index=False)
from google.colab import files
files.download('df.csv')
After checking that all the coordinates were generated correctly (if not, you can add them manually), let’s create a map with the geospatial data points. To save the .html file, I’ll mount Google Drive to Google Colab.
from google.colab import drive
drive.mount('/content/drive')
I’ll create a map and save the .html file on your PC.
#!pip install folium
import folium

# Drop rows with missing latitude or longitude values
df_clean = df.dropna(subset=["latitude", "longitude"])

# Define the center of the map
map_center = [df_clean["latitude"].mean(), df_clean["longitude"].mean()]
college_map = folium.Map(location=map_center, zoom_start=11)

# Add red points for each location
for _, row in df_clean.iterrows():
    folium.CircleMarker(
        location=[row["latitude"], row["longitude"]],
        radius=5,
        color="red",
        fill=True,
        fill_color="red",
        fill_opacity=0.7,
    ).add_to(college_map)

# Save and display the interactive map
map_path = "/content/drive/MyDrive/Colab/Python_code/college_map.html"
college_map.save(map_path)
map_path
Now, the .html file is saved in the file path of my Google Drive. First, I’ll view the map in my Google Colab.
import os
import shutil  # Add this line
from google.colab import output

# Define the file path (ensure this is set correctly)
file_path = "<mark style="background-color:rgba(0, 0, 0, 0)" class="has-inline-color has-vivid-red-color">/content/drive/MyDrive/Colab/Python_code/college_map.html</mark>"

# Copy file to /content/ to avoid Google Drive access restrictions
shutil.copy(file_path, "/content/college_map.html")

# Start a web server
os.system("python3 -m http.server 8888 -d /content &")

# Serve the file as an iframe
output.serve_kernel_port_as_iframe(8888, path="college_map.html")
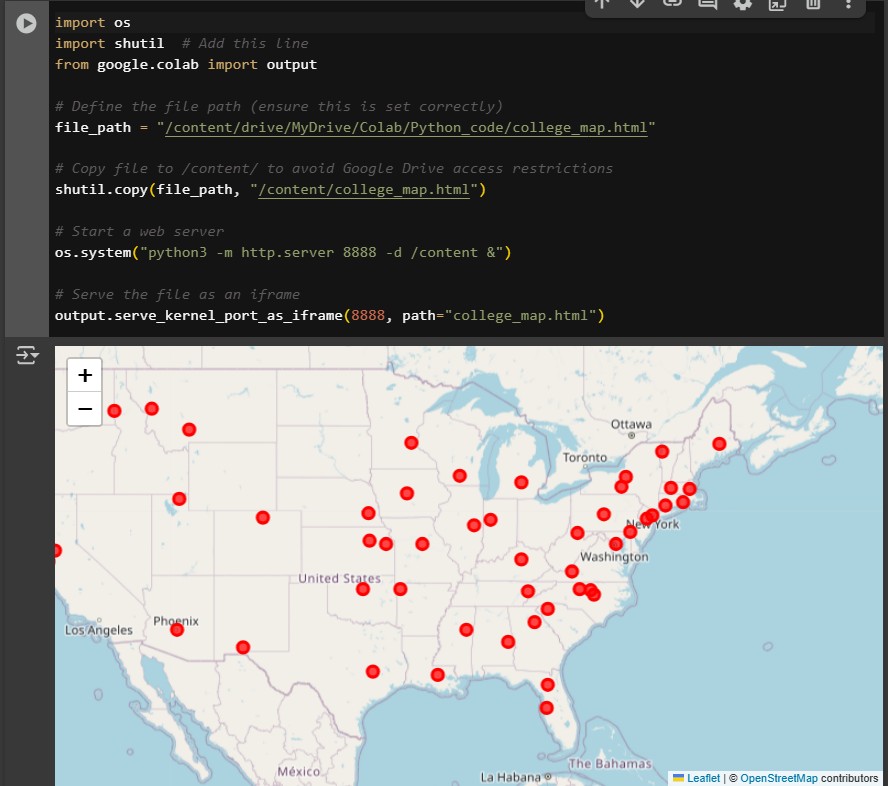
The map was created successfully. This map shows where agricultural colleges in the U.S. are located.
Next, I’ll download the .html file to my PC.
from google.colab import files
files.download('/content/drive/MyDrive/Colab/Python_code/college_map.html')
Here is a code summary. You can copy and paste the full code into your Google Colab, and you will obtain the same .html file.
#code summary https://github.com/agronomy4future/python_code/blob/main/Visualizing_Geospatial_Data_with_Folium_in_Python.ipynb
We aim to develop open-source code for agronomy ([email protected])
© 2022 – 2025 https://agronomy4future.com – All Rights Reserved.
Last Updated: 02/12/2025