I will introduce how to perform a Two-Way ANOVA analysis using SAS Studio. Here is the data that you have available:
   Cultivar Nitrogen Block Yield
1       CV1       N0     I    99
2       CV1       N0    II   109
3       CV1       N0   III    89
4       CV1       N1     I   115
5       CV1       N1    II   142
6       CV1       N1   III   133
7       CV1       N2     I   121
8       CV1       N2    II   157
9       CV1       N2   III   142
10      CV1       N3     I   125
11      CV1       N3    II   150
12      CV1       N3   III   139
13      CV2       N0     I    82
14      CV2       N0    II   104
15      CV2       N0   III    99
16      CV2       N1     I   117
17      CV2       N1    II   125
18      CV2       N1   III   127
19      CV2       N2     I   145
20      CV2       N2    II   154
21      CV2       N2   III   154
22      CV2       N3     I   151
23      CV2       N3    II   166
24      CV2       N3   III   175
<strong># </strong>Download the above data to Excel using R
Cultivar= rep(c("CV1","CV2"),each=12)
Nitrogen= rep(rep(c("N0","N1","N2","N3"), each=3),2)
Block= rep(c("I","II","III"),8)
Yield= c (99, 109, 89, 115, 142, 133, 121, 157, 142, 125, 150, 139, 82, 104, 99, 117, 125, 127, 145, 154, 154, 151, 166, 175)
dataA= data.frame(Cultivar,Nitrogen,Block,Yield)

install.package("writexl")
library(writexl)
write_xlsx (DataA,"<span style="background-color:rgba(0, 0, 0, 0)" class="has-inline-color has-vivid-red-color">C:/Users/LG/Desktop</span>/dataA.xlsx")
<span style="background-color:rgba(0, 0, 0, 0)" class="has-inline-color has-vivid-red-color"># Please confirm the directory path on your computer</span>
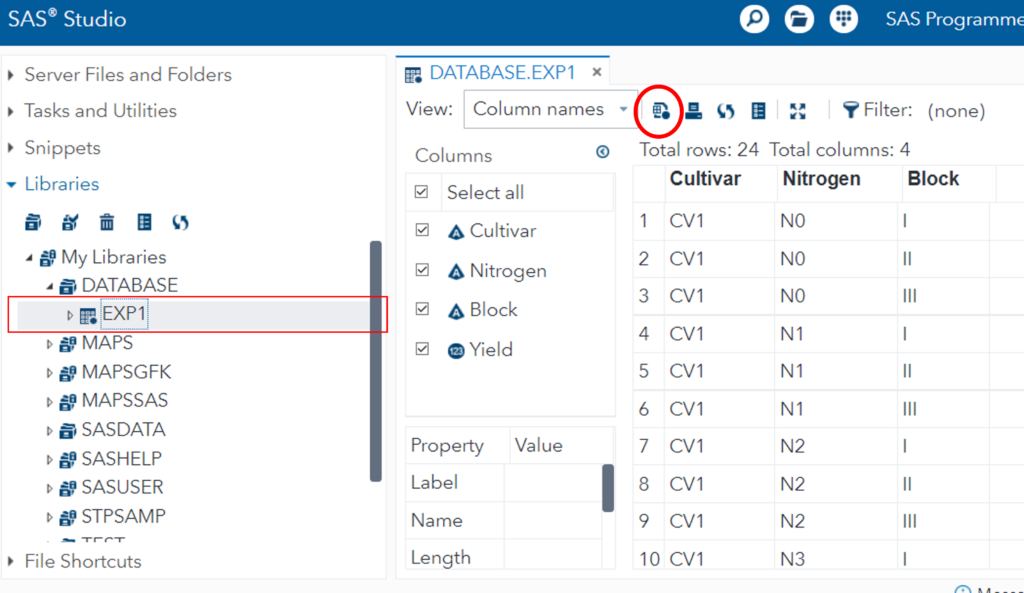
Upload this Excel file to SAS Studio. After uploading the Excel file to SAS Studio, create a data table named “EXP1” in My Libraries. Then, click on the EXP1 data table. Then, select the icon for generating code located at the top.
By doing so, a new tab named “Program 1” will be created, allowing you to generate the code.
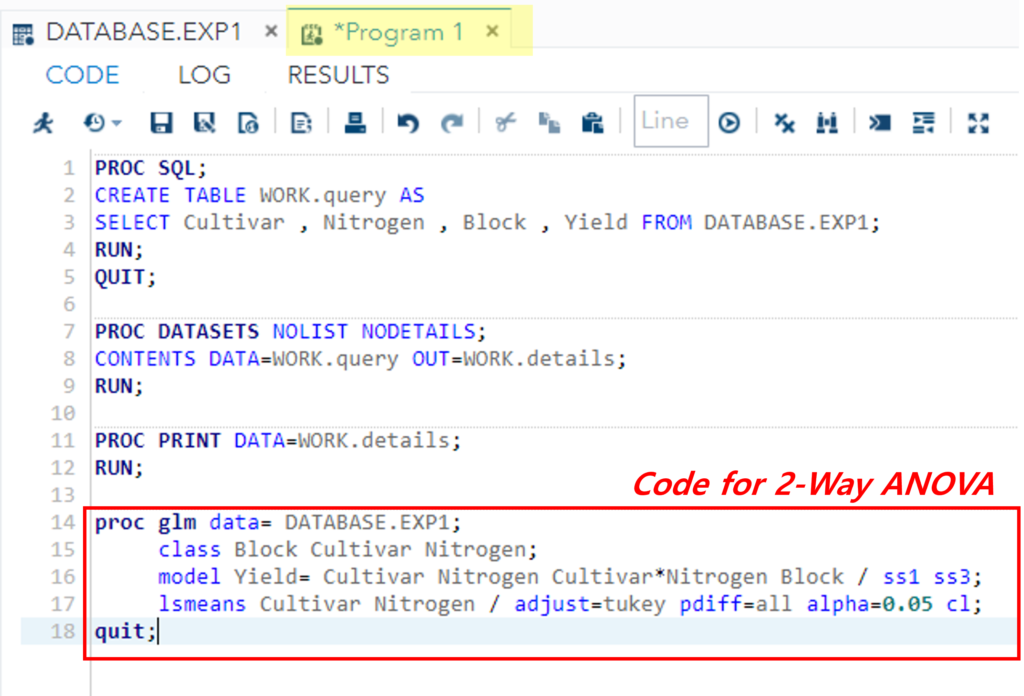
Indeed, R Studio provides essential statistical modeling tools that enable you to select variables based on the model and examine statistical outcomes without the need to write code. However, in this case, I will demonstrate the process of performing ANOVA using SAS code. Let’s input the following code into the code editor and execute it.
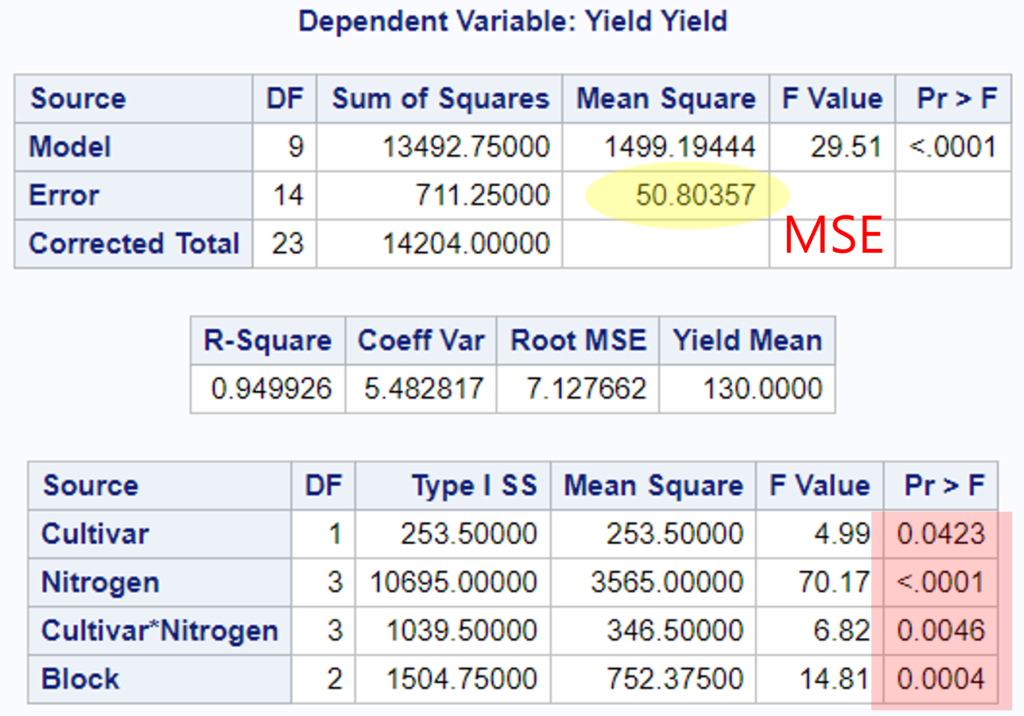
<strong>proc glm </strong><span class="has-inline-color has-vivid-cyan-blue-color">data</span>= DATABASE.EXP1;
	 <span class="has-inline-color has-vivid-cyan-blue-color">class</span> Block Cultivar Nitrogen;
	 <span class="has-inline-color has-vivid-cyan-blue-color">model</span> Yield= Cultivar Nitrogen Cultivar*Nitrogen / <span class="has-inline-color has-vivid-cyan-blue-color">ss1 ss3</span>;
	 <span class="has-inline-color has-vivid-cyan-blue-color">lsmeans</span> Cultivar Nitrogen / <span class="has-inline-color has-vivid-cyan-blue-color">adjust</span>=tukey <span class="has-inline-color has-vivid-cyan-blue-color">pdiff</span>=all <span class="has-inline-color has-vivid-cyan-blue-color">alpha</span>=0.05 <span class="has-inline-color has-vivid-cyan-blue-color">cl</span>;
<strong>quit;</strong>
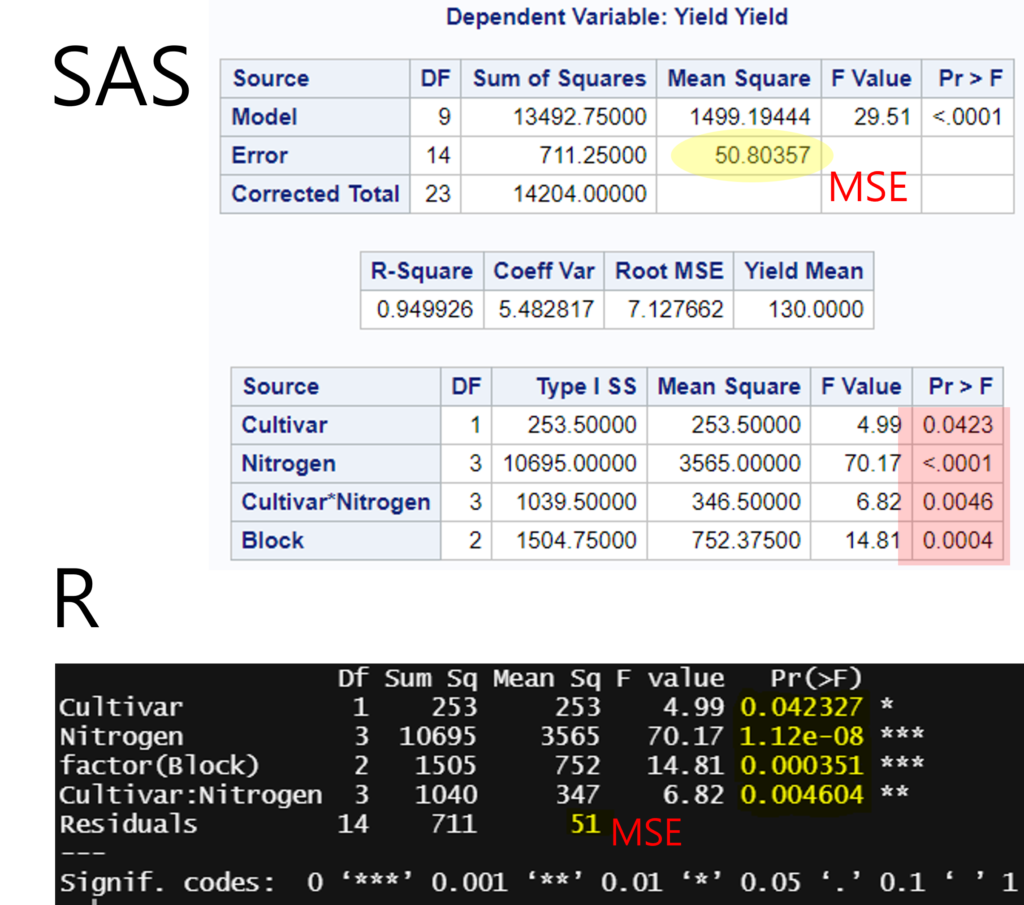
I will verify the accuracy of the above results using R.
ANOVA= aov(Yield ~ Cultivar + Nitrogen + Cultivar:Nitrogen + factor(Block), data=dataA)
summary(ANOVA)