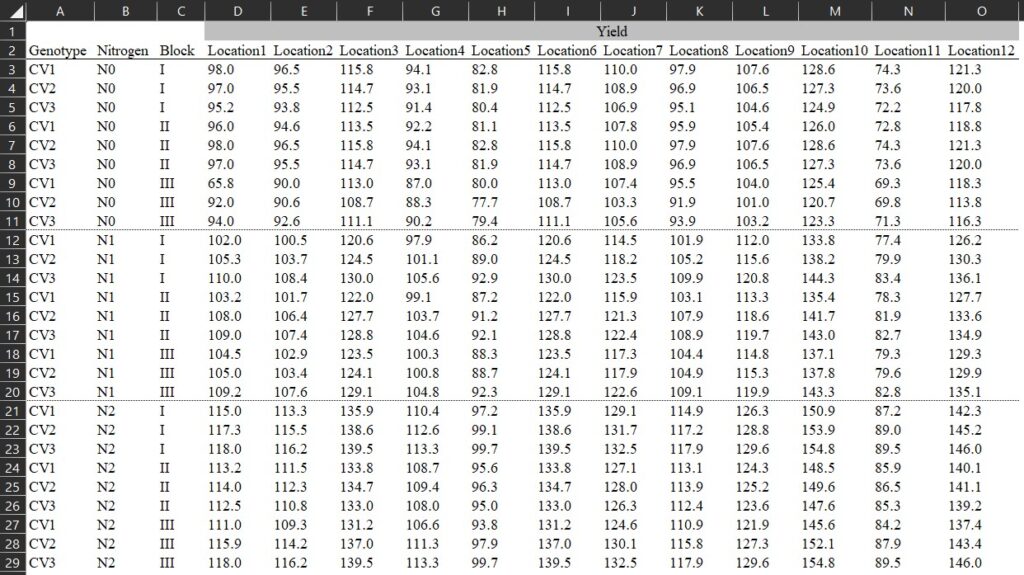
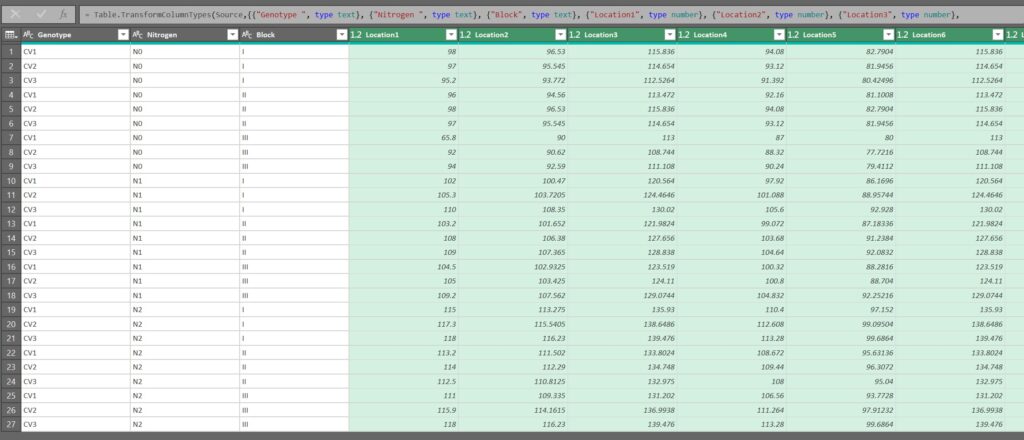
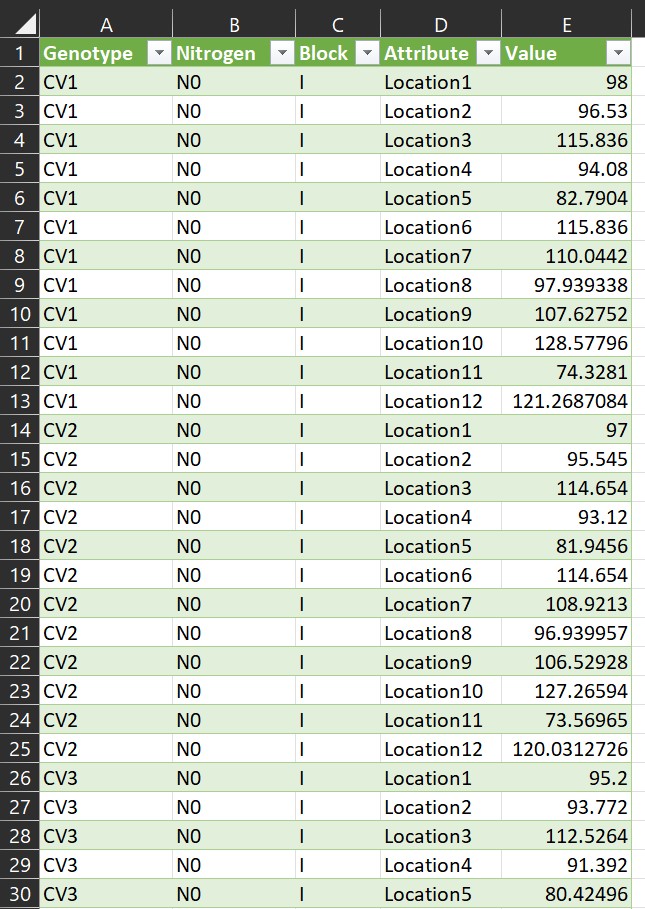
Sometimes, I see many people organizing their data in columns, as shown in the example below. This format may seem convenient because it allows us to view all the data at once. However, it poses problems for data analysis, which fundamentally relies on variables — namely, independent and dependent variables.
Download data file (.csv)
https://github.com/agronomy4future/raw_data_practice/blob/main/yield_per_location.csv
In the given data format, each level of the independent variable (i.e., location) is not combined into a single column, so we need to rearrange the data. If the number of columns is small, copying and pasting them into rows may be feasible. However, with hundreds of columns, it would be impractical to do this one by one.
Today, I will introduce the simplest and most efficient way to transpose column data into row data.

1) Power Query in Excel
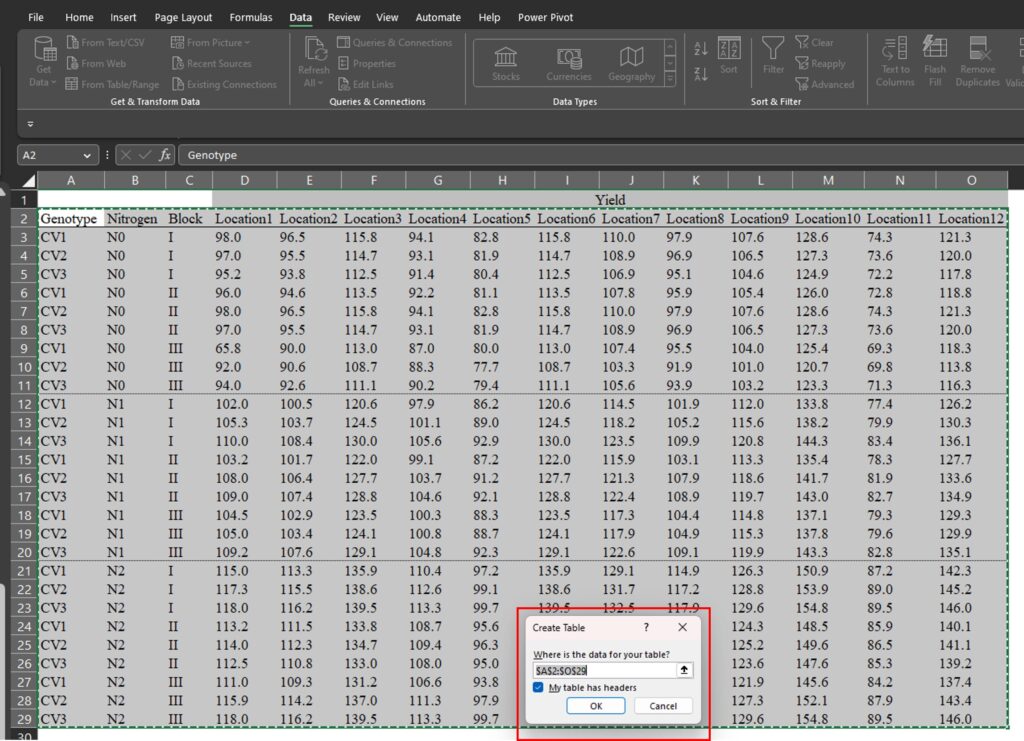
Using the Query function, we can quickly transpose column data into row data. First, select the entire data you want to transpose by dragging over it. Then, choose Data > From Table/Range
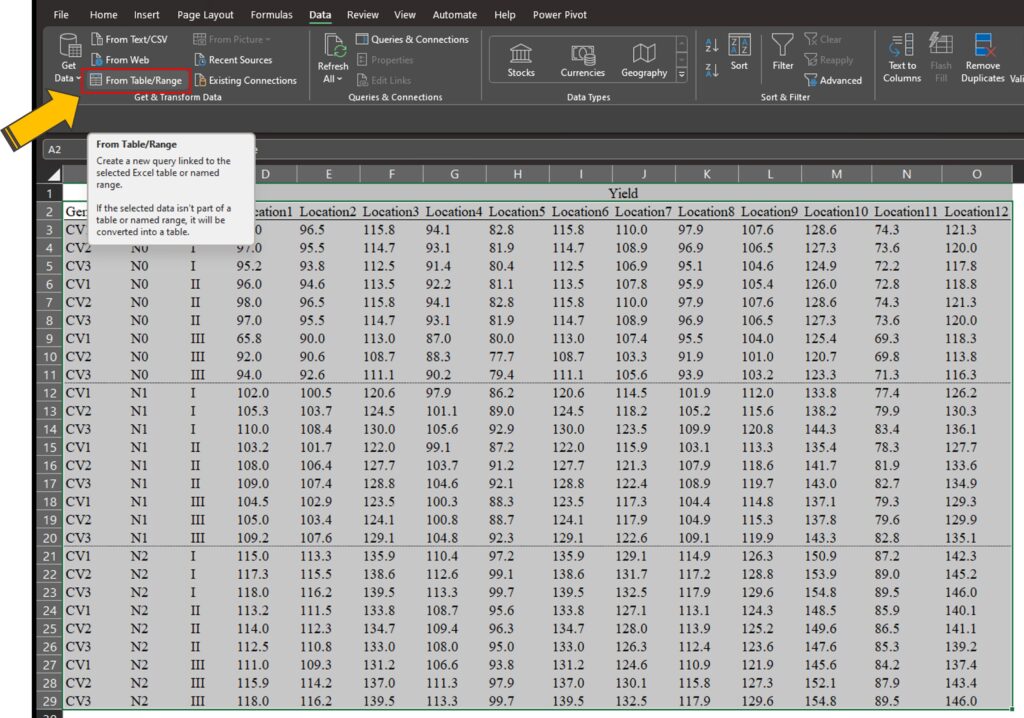
you will see it displayed. Then, click Ok.
A new window, called Power Query Editor, will open up.
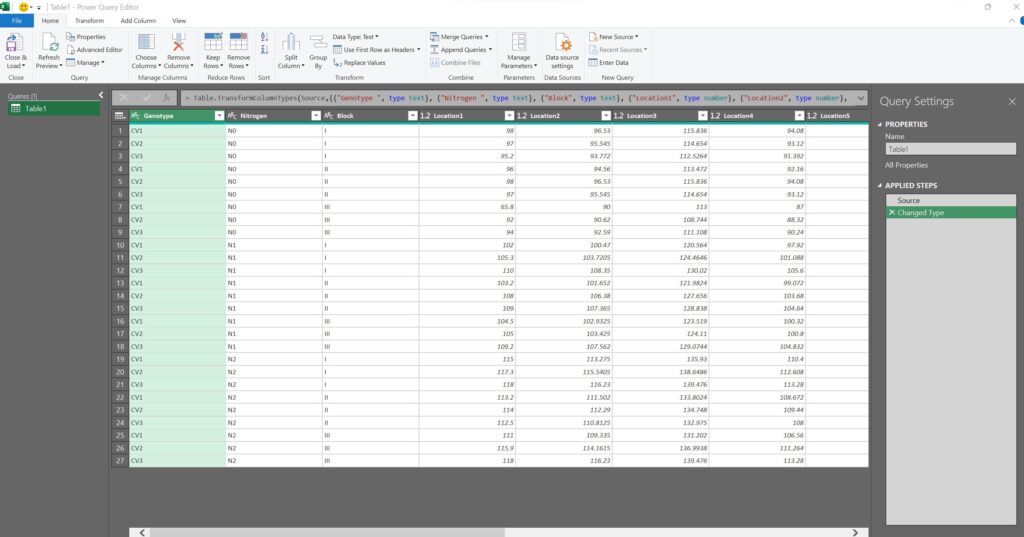
Let’s now select all of the location columns (from Location1 to Location12).
After selecting all of the location columns, click on Transform > Unpivot Columns
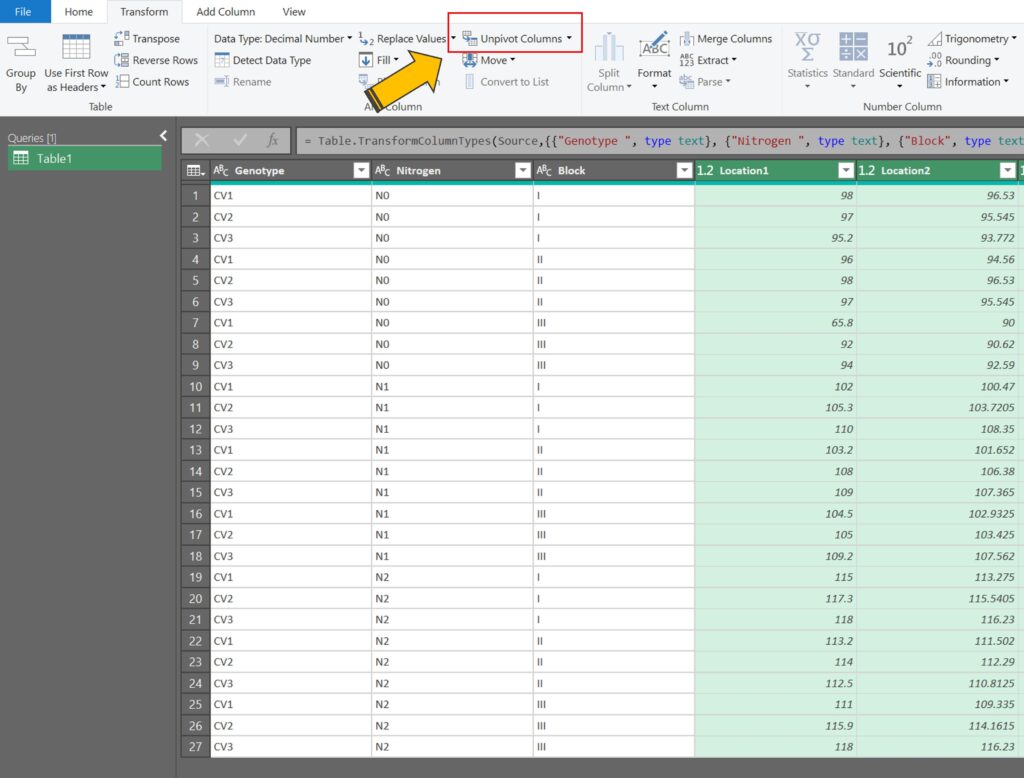
Automatically, all of the column data will be transposed into rows.
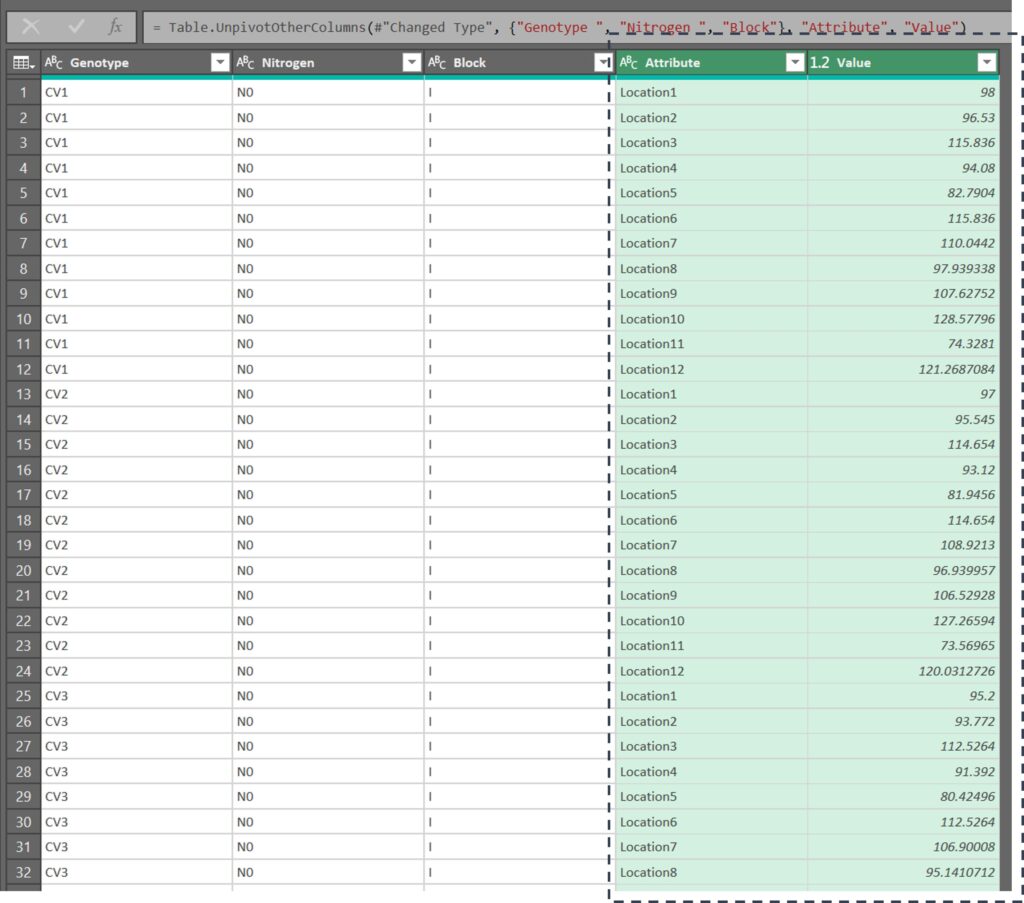
We are currently in the Power Query Editor. To exit this window and apply the changes we’ve made to the original data, click on the Close & Load button.
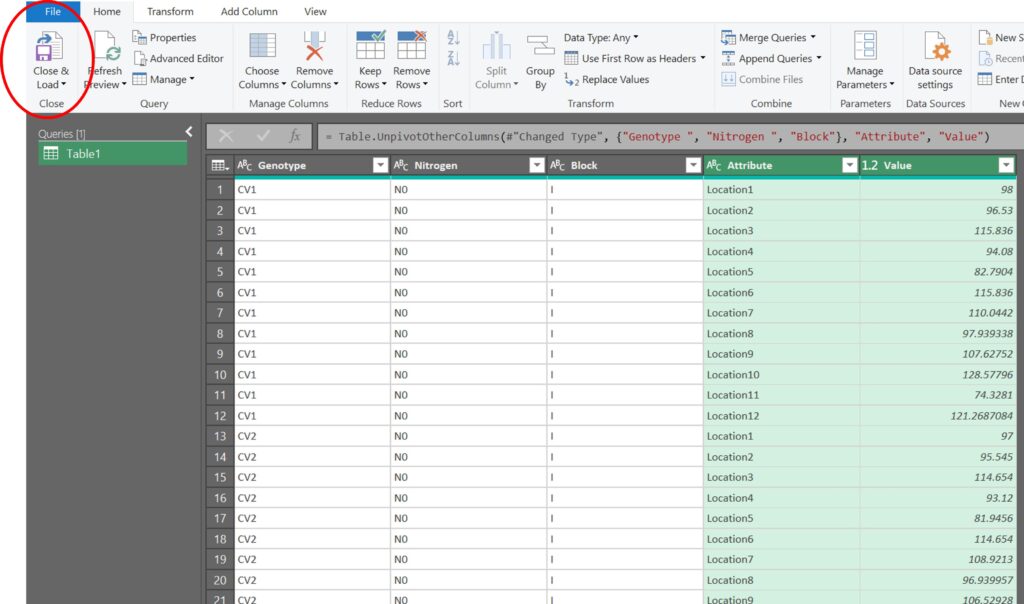
Great! The new data format is now ready.
2) Using the reshape2 in R
Now, let’s explore how to use R to achieve the same result. First, we need to upload the Excel file.
if(!require(remotes)) install.packages("readr")
library (readr)

github="https://raw.githubusercontent.com/agronomy4future/raw_data_practice/main/yield_per_location.csv"
df=data.frame(read_csv(url(github),show_col_types= FALSE))

print(head(df,3))
  Genotype Nitrogen Block Location1 Location2 Location3 Location4 Location5
1      CV1       N0     I      98.0      96.5     115.8      94.1      82.8
2      CV2       N0     I      97.0      95.5     114.7      93.1      81.9
3      CV3       N0     I      95.2      93.8     112.5      91.4      80.4
  Location6 Location7 Location8 Location9 Location10 Location11 Location12
1     115.8     110.0      97.9     107.6      128.6       74.3      121.3
2     114.7     108.9      96.9     106.5      127.3       73.6      120.0
3     112.5     106.9      95.1     104.6      124.9       72.2      117.8
.
.
.
To transpose all of the column data into rows using the reshape2 package, we need to install the package first.
if(!require(reshape2)) install.packages("reshape2")
library(reshape2)
and run the following code.
df1=reshape2::melt(df, id.vars=c("Genotype", "Nitrogen", "Block"))

print(head(df1,3))
  Genotype Nitrogen Block  variable value
1      CV1       N0     I Location1  98.0
2      CV2       N0     I Location1  97.0
3      CV3       N0     I Location1  95.2
.
.
.
All of the locations have now been transposed into rows. Next, I’ll change the column names.
colnames(df1)[4]= c("Location")
colnames(df1)[5]= c("Yield")

print(head(df1,3))
  Genotype Nitrogen Block  Location Yield
1      CV1       N0     I Location1  98.0
2      CV2       N0     I Location1  97.0
3      CV3       N0     I Location1  95.2
.
.
.
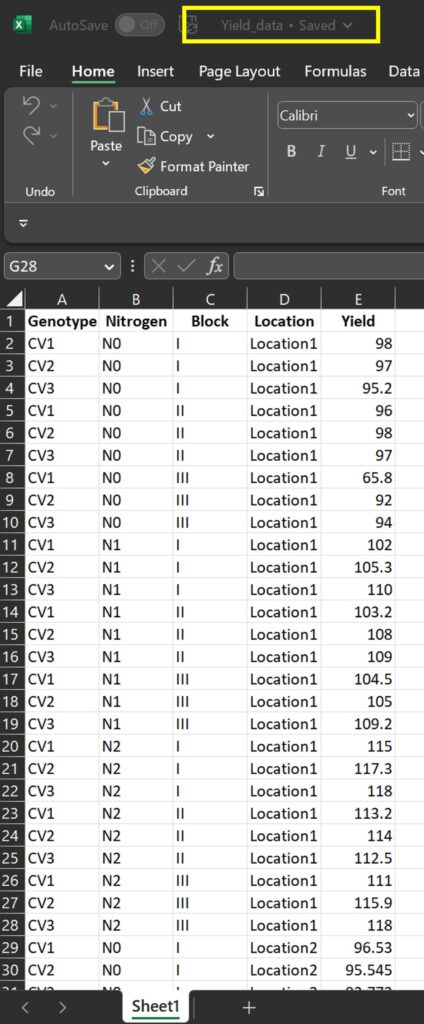
After that, I’ll export this data to an Excel file on my PC and save it with the name ‘Yield_data’.
if(!require(writexl)) install.packages("writexl")
library(writexl)

write_xlsx (df1,"<mark style="background-color:rgba(0, 0, 0, 0)" class="has-inline-color has-vivid-cyan-blue-color">C:/Users/OneDrive/Desktop/</mark>Yield_data.xlsx")
<mark style="background-color:rgba(0, 0, 0, 0)" class="has-inline-color has-vivid-cyan-blue-color"># Please check the pathway in your computer</mark>
Let’s now compare the new data format generated by Power Query and R. They should be identical.
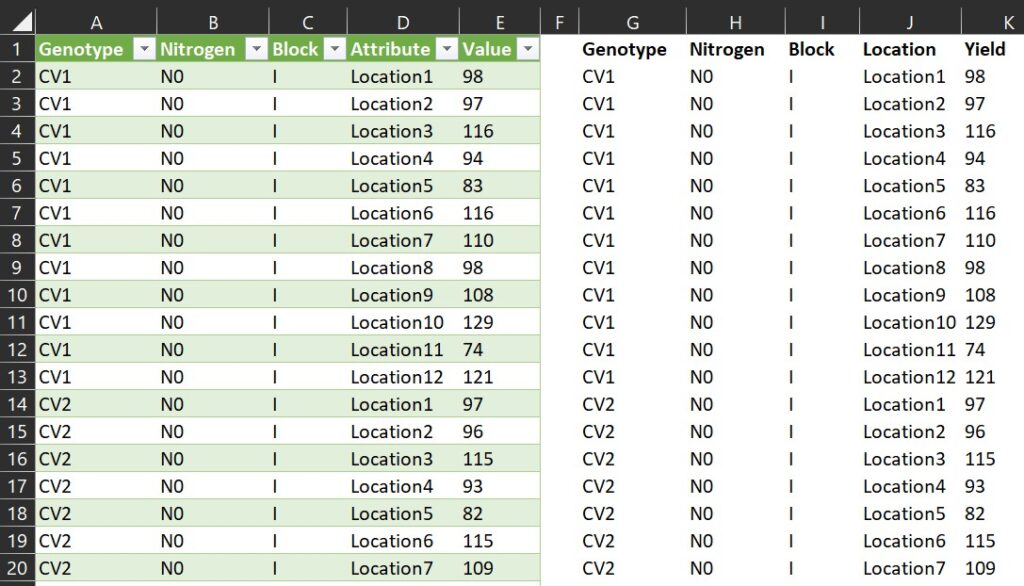
Starting now, let’s avoid manually copying and pasting data to transpose it from columns to rows.
3) Using the pivot_longer() in R
if(!require(dplyr)) install.packages("dplyr")
if(!require(tidyr)) install.packages("tidyr")
library(dplyr)
library(tidyr)

df.transpose= data.frame(df %>%
       group_by(Genotype, Nitrogen, Block) %>%
       pivot_longer(
       cols= c(Location1, Location2, Location3, Location4, Location5,
               Location6, Location7, Location8, Location9, Location10,
               Location11, Location12),
       names_to= "Location",
       values_to= "Yield"))

print(head(df.transpose,3))
  Genotype Nitrogen Block  Location Yield
1      CV1       N0     I Location1  98.0
2      CV1       N0     I Location2  96.5
3      CV1       N0     I Location3 115.8
.
.
.
Extra Tip!! When only one variable is present
If we have only one variable, we can simply transpose the columns to rows using the following code. For example, if the data is formatted as shown below:
if(!require(remotes)) install.packages("readr")
library (readr)

github="https://raw.githubusercontent.com/agronomy4future/raw_data_practice/main/yield_per_location.csv"
df=data.frame(read_csv(url(github),show_col_types= FALSE))
df=df[,c(-1,-2,-3)]
df

   Location1 Location2 Location3 Location4 Location5  . . .
1       98.0      96.5     115.8      94.1      82.8
2       97.0      95.5     114.7      93.1      81.9
3       95.2      93.8     112.5      91.4      80.4
4       96.0      94.6     113.5      92.2      81.1
5       98.0      96.5     115.8      94.1      82.8
.
.
df1= stack(df)

print(head(df1,5))
   values  ind
1  98.0    Location1
2  97.0    Location1
3  95.2    Location1
4  96.0    Location1
5  98.0    Location1
.
.
.

names(df1)= c("Yield","Location")

print(head(df1,5))
    Yield   Location
1    98.0  Location1
2    97.0  Location1
3    95.2  Location1
4    96.0  Location1
5    98.0  Location1
.
.
.
We aim to develop open-source code for agronomy ([email protected])
© 2022 – 2025 https://agronomy4future.com – All Rights Reserved.
Last Updated: 26/April/2023