If you update to ChatGPT Plus version, we can access Data Analyst, and “you can create graphs by texting instead of coding“.
Let’s upload a dataset into Data Analyst. This dataset contains data about Fe uptake on wheat grains. If you run the following R code, you can download the data from my GitHub.
library(readr)
github="https://raw.githubusercontent.com/agronomy4future/raw_data_practice/main/wheat_grain_Fe_uptake.csv"
dataA= data.frame(read_csv(url(github), show_col_types=FALSE))

library(writexl)
write_xlsx (dataA,"C:/Users/Desktop/wheat_grain_Fe_uptake.xlsx")
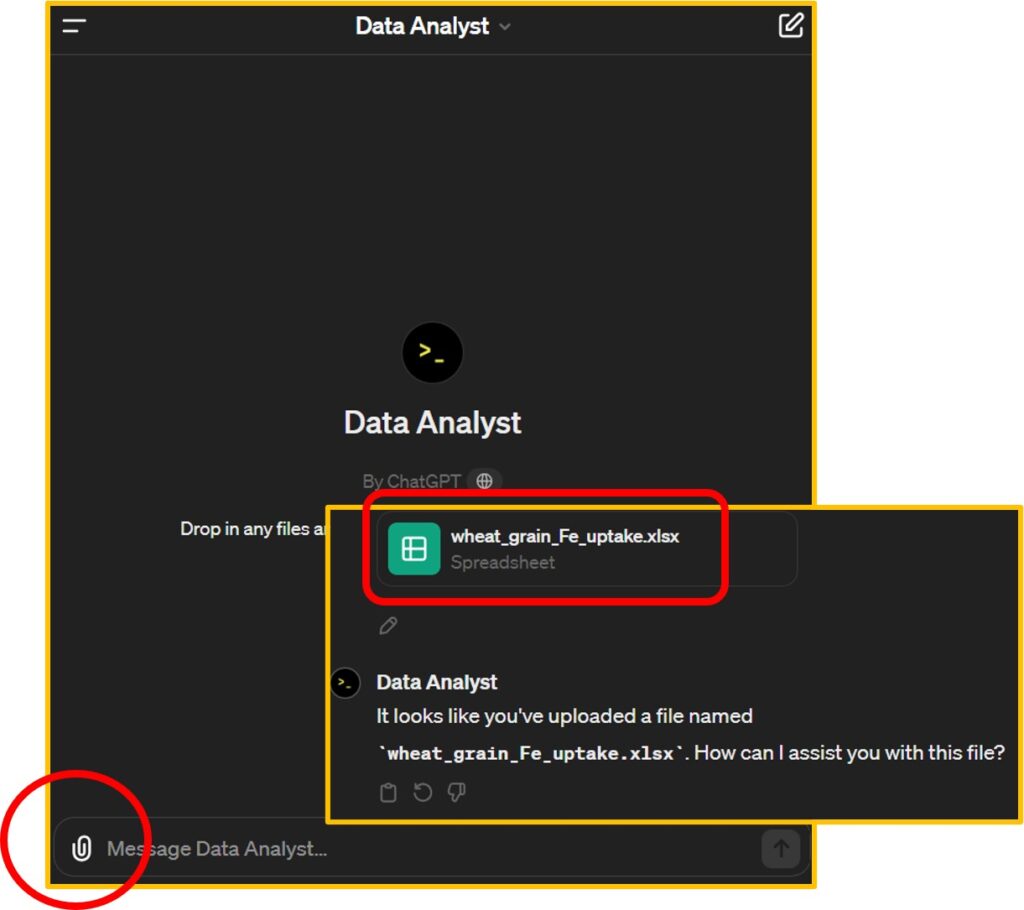
After downloading the data, let’s proceed to Data Analyst, click the upload button, and upload the data file.
ChatGPT - Data Analyst
Starting now, I’ll be texting to summarize data tables and create graphs. First, I’d like to request the creation of a mean summarized data table with standard error. Data Analyst not only provides the data table but also offers Python code related to this dataset, which adds to its amazing capabilities.
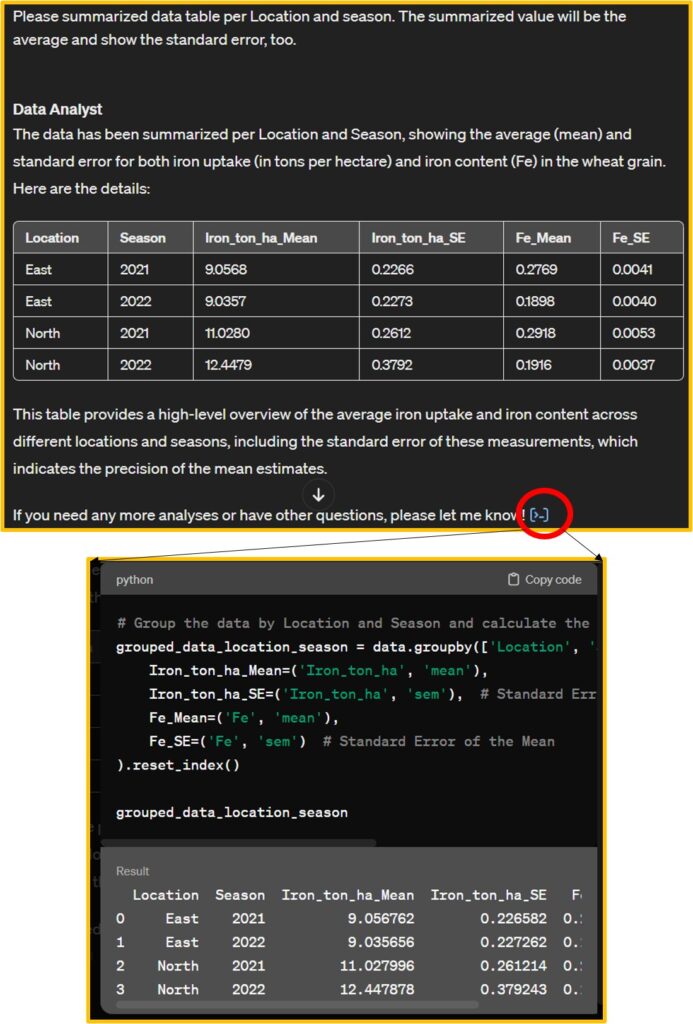
<strong># Group the data by Location and Season and calculate the mean and standard error for Iron_ton_ha and Fe</strong>
<mark style="background-color:rgba(0, 0, 0, 0)" class="has-inline-color has-vivid-cyan-blue-color">grouped_data_location_season = data.groupby(['Location', 'Season']).agg(
    Iron_ton_ha_Mean=('Iron_ton_ha', 'mean'),
    Iron_ton_ha_SE=('Iron_ton_ha', 'sem'),  # Standard Error of the Mean
    Fe_Mean=('Fe', 'mean'),
    Fe_SE=('Fe', 'sem')  # Standard Error of the Mean
).reset_index()</mark>
I’ll copy this code in my Google Colab and run this code to check this code is correct.
import pandas as pd
import requests
from io import StringIO

github="https://raw.githubusercontent.com/agronomy4future/raw_data_practice/main/wheat_grain_Fe_uptake.csv"
response=requests.get(github)
dataA=pd.read_csv(StringIO(response.text))

<mark style="background-color:rgba(0, 0, 0, 0)" class="has-inline-color has-vivid-cyan-blue-color">grouped_data_location_season = dataA.groupby(['Location', 'Season']).agg(
    Iron_ton_ha_Mean=('Iron_ton_ha', 'mean'),
    Iron_ton_ha_SE=('Iron_ton_ha', 'sem'),  # Standard Error of the Mean
    Fe_Mean=('Fe', 'mean'),
    Fe_SE=('Fe', 'sem')  # Standard Error of the Mean
).reset_index()</mark>
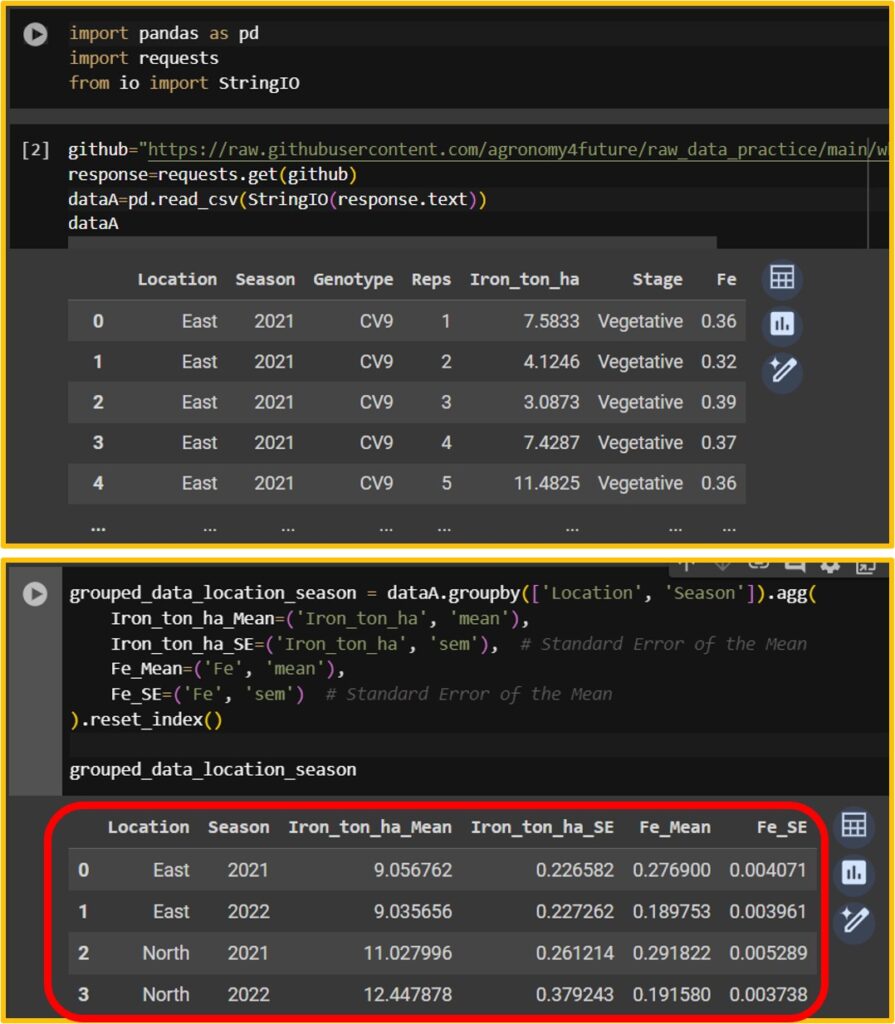
When I run the code Data Analyst provides, I can obtain the same data table.
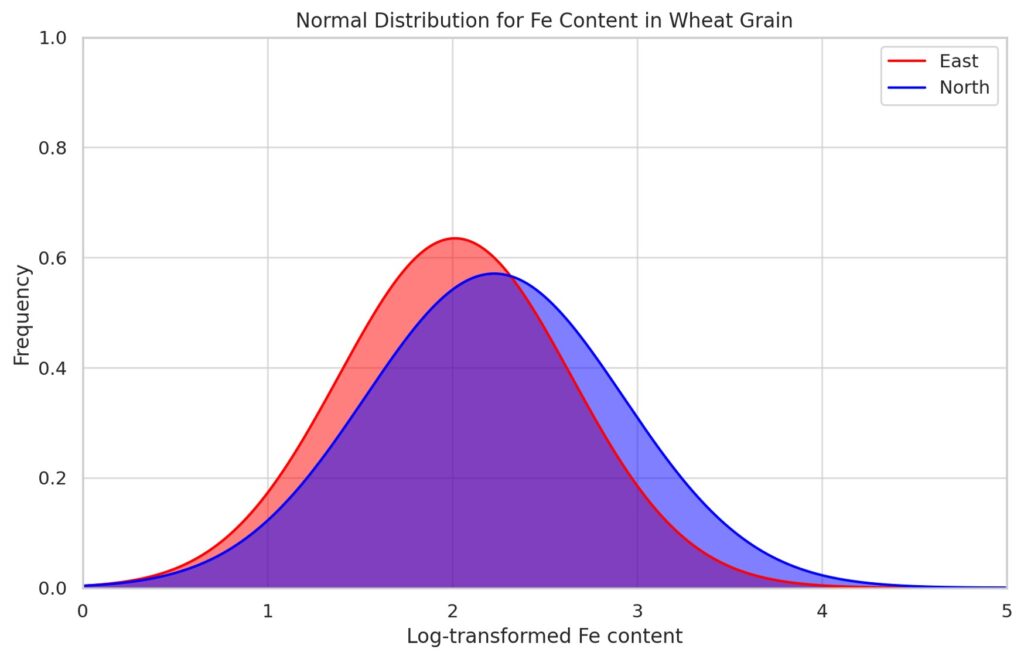
Next, I’ll proceed to create a graph. I requested Data Analyst to generate a normal distribution graph.
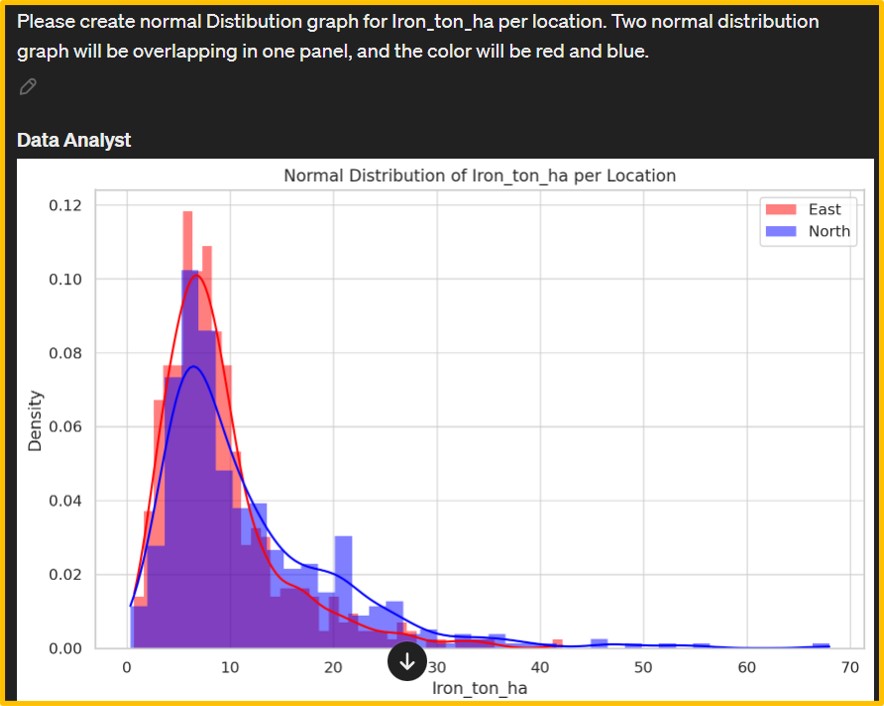
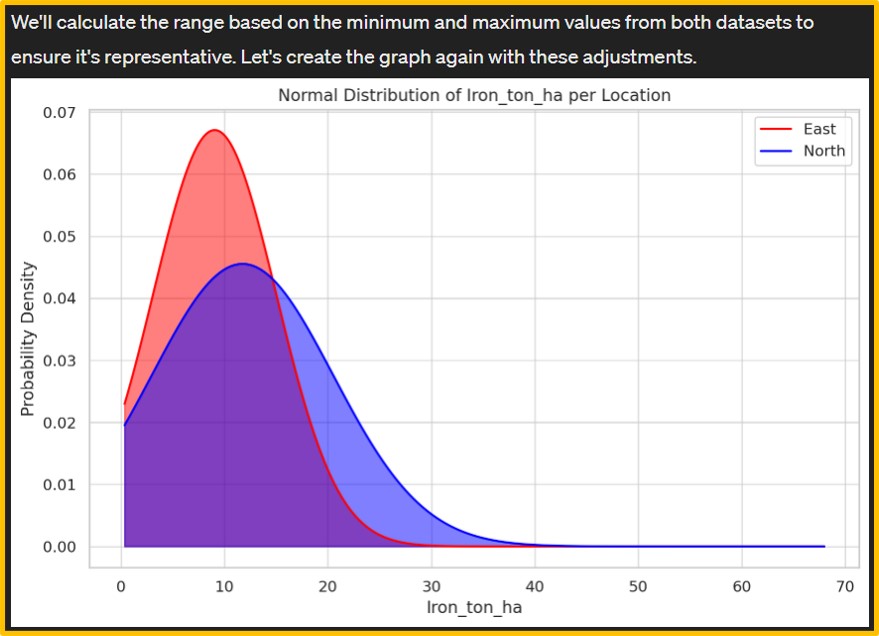
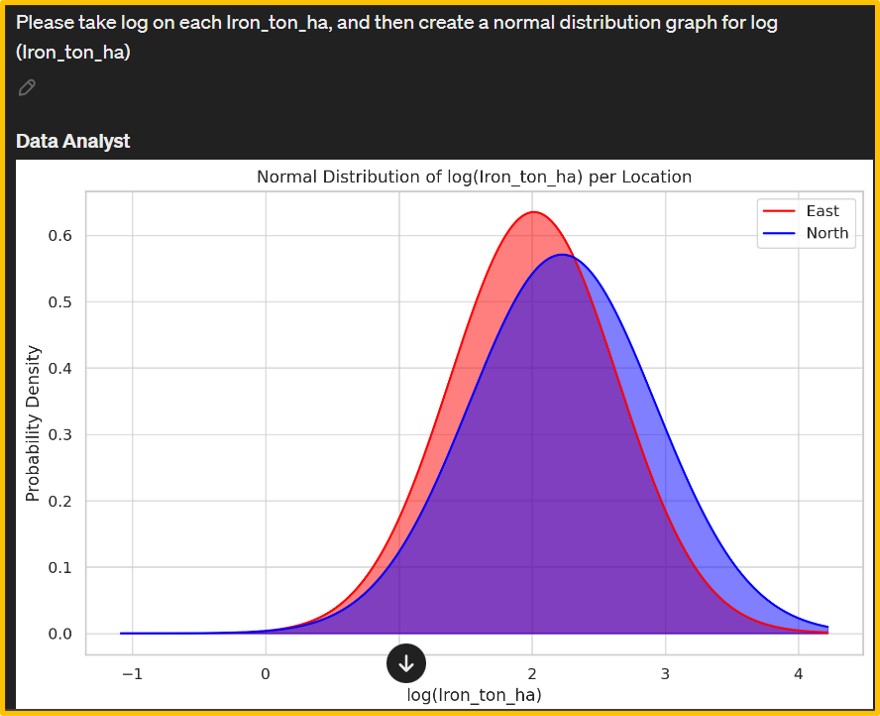
However, the initial output was a density graph (left figure). Consequently, I provided additional details about the desired normal distribution graph, leading Data Analyst to generate a new graph (right figure). The iron content data on wheat grains appears to deviate from normality. Hence, I requested Data Analyst to apply a logarithmic transformation to the iron content and then generate a normal distribution graph.
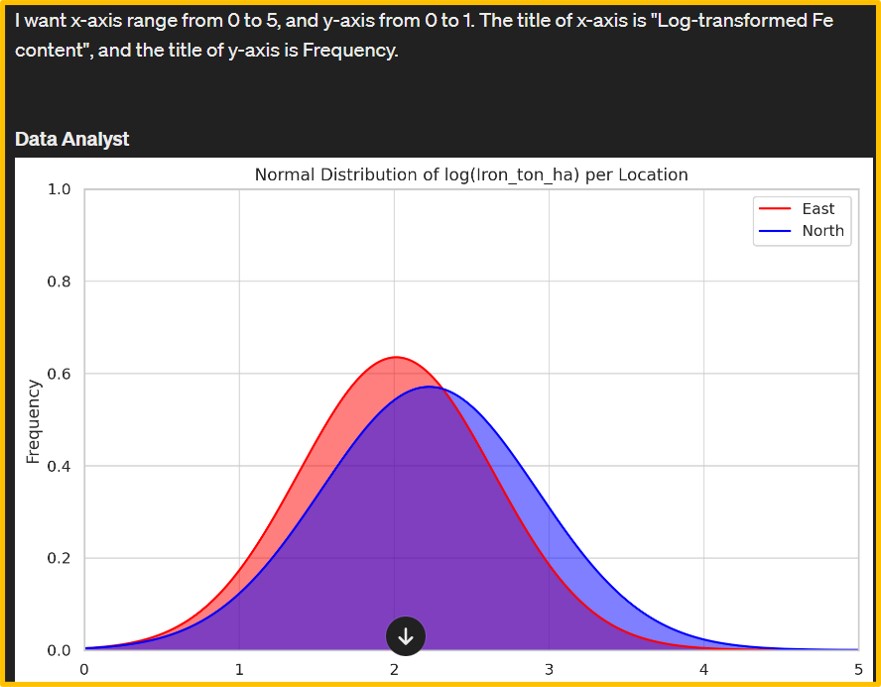
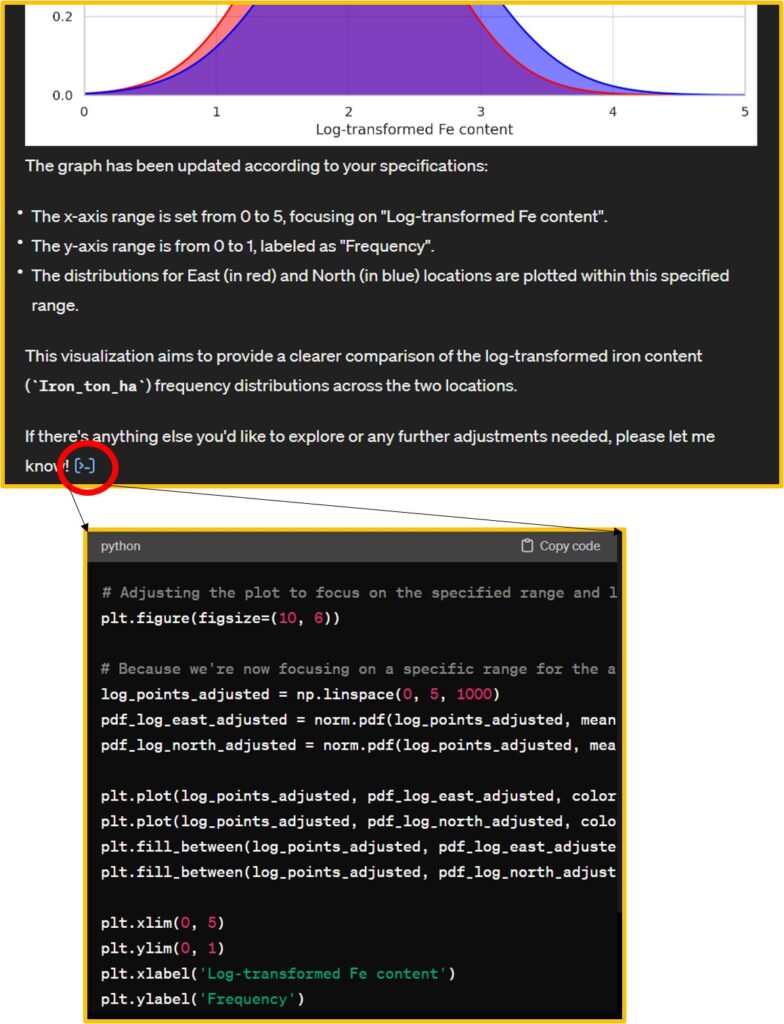
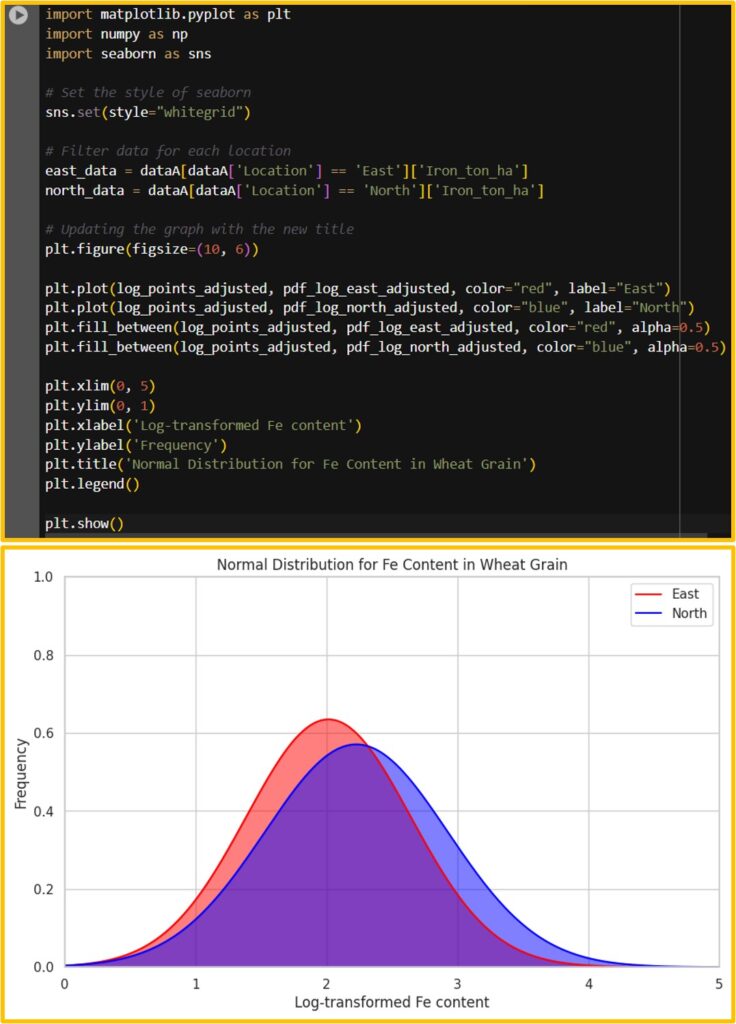
Afterward, I adjusted the range and titles of the x and y axes to enhance clarity and relevance. Data Analyst also provide Python code.
import matplotlib.pyplot as plt
import numpy as np
import seaborn as sns

# Set the style of seaborn
sns.set(style="whitegrid")

# Filter data for each location
east_data = dataA[dataA['Location'] == 'East']['Iron_ton_ha']
north_data = dataA[dataA['Location'] == 'North']['Iron_ton_ha']

# Updating the graph with the new title
plt.figure(figsize=(10, 6))

plt.plot(log_points_adjusted, pdf_log_east_adjusted, color="red", label="East")
plt.plot(log_points_adjusted, pdf_log_north_adjusted, color="blue", label="North")
plt.fill_between(log_points_adjusted, pdf_log_east_adjusted, color="red", alpha=0.5)
plt.fill_between(log_points_adjusted, pdf_log_north_adjusted, color="blue", alpha=0.5)

plt.xlim(0, 5)
plt.ylim(0, 1)
plt.xlabel('Log-transformed Fe content')
plt.ylabel('Frequency')
plt.title('Normal Distribution for Fe Content in Wheat Grain')
plt.legend()

plt.show()
I’ll run this code in Google Colab. We can obtain the same graph.
This is a new paradigm shift because texting could be directly converted into coding. The paragraph below is what I typed in Data Analyst, and based on this text, ChatGPT converted it into code.
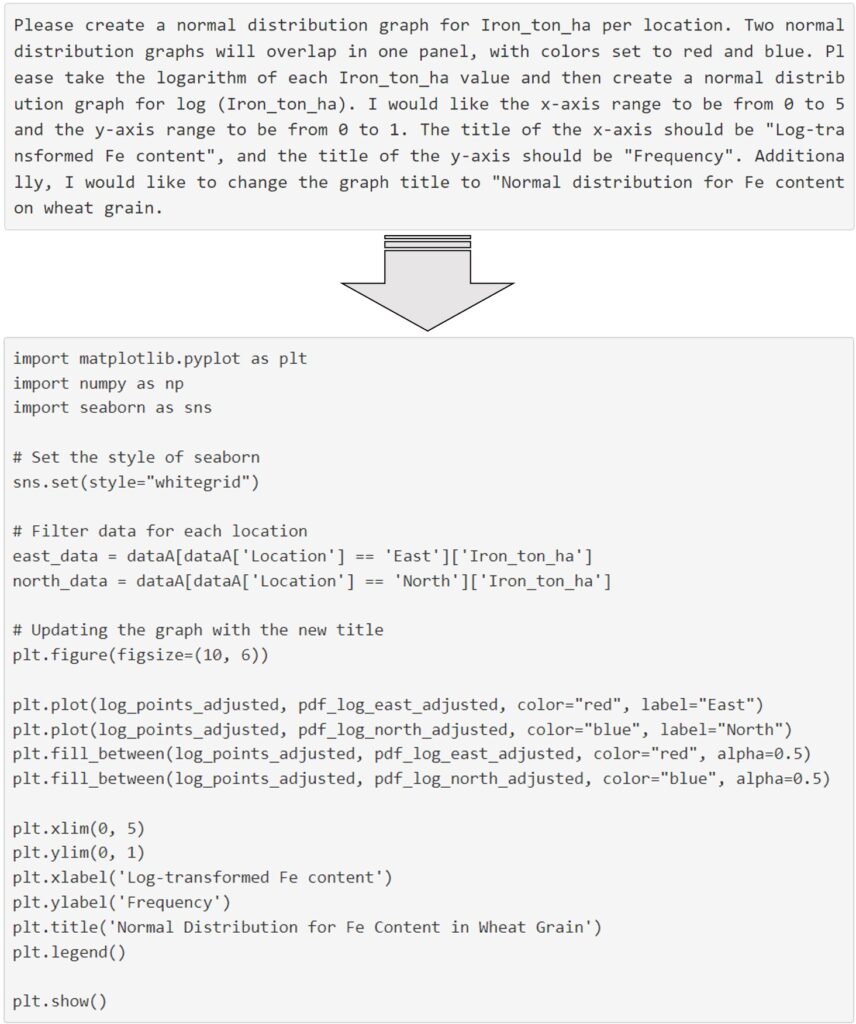
full code: https://github.com/agronomy4future/python_code/blob/main/Generating_Graphs_and_Summarizing_Data_Tables.ipynb