All VBA codes I suggested are summarized in my github.
https://github.com/agronomy4future/VBA/blob/main/adjusting_axis
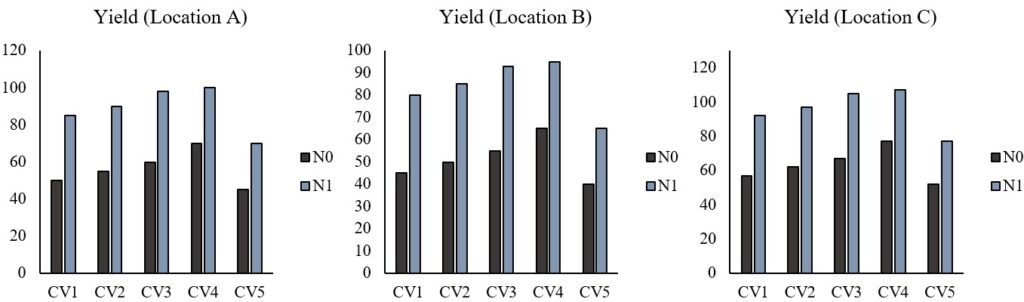
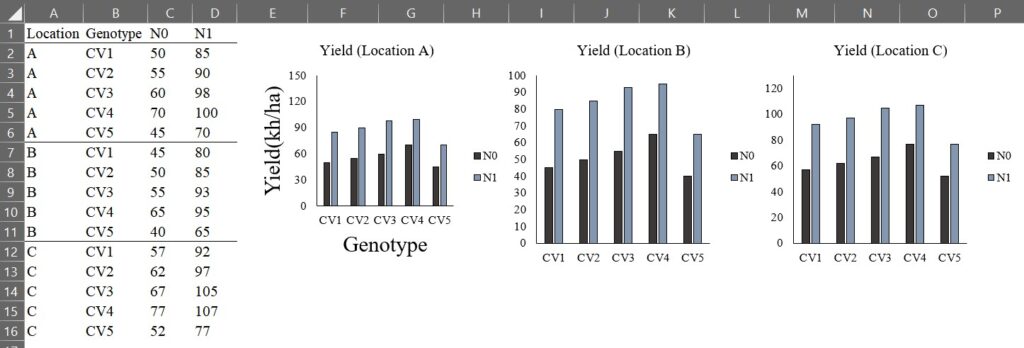
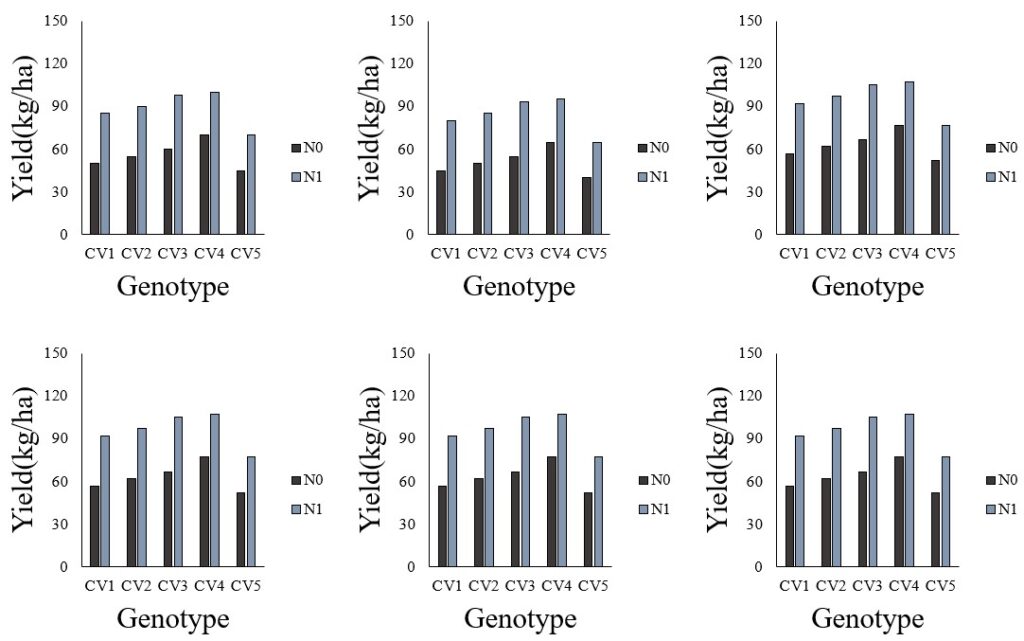
Here is one data, and I made three bar graphs per location.
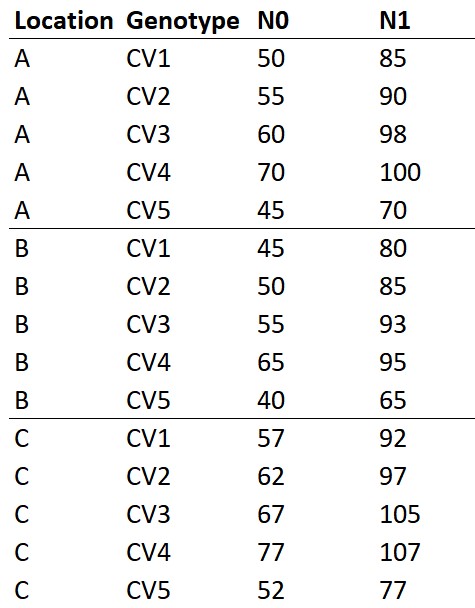
You can download above data in my github.
https://github.com/agronomy4future/raw_data_practice/blob/main/VBA_practice.csv
Now, I’d like to add a title in x and y axis, and adjust the range and unit in y-axis. Of course, we can change it in each graph, but if there are 100 graphs, will you still do it one by one? We don’t have time to do such useless things.
Using VBA would be the powerful tool to change and adjust lots of graphs at a time. Today, I’ll introduce how to add a title and adjust in x and y-axis at a time using VBA.
First, open the VBA window, easily we can open as Alt + F11. Then, open the Module window (Insert → Module).
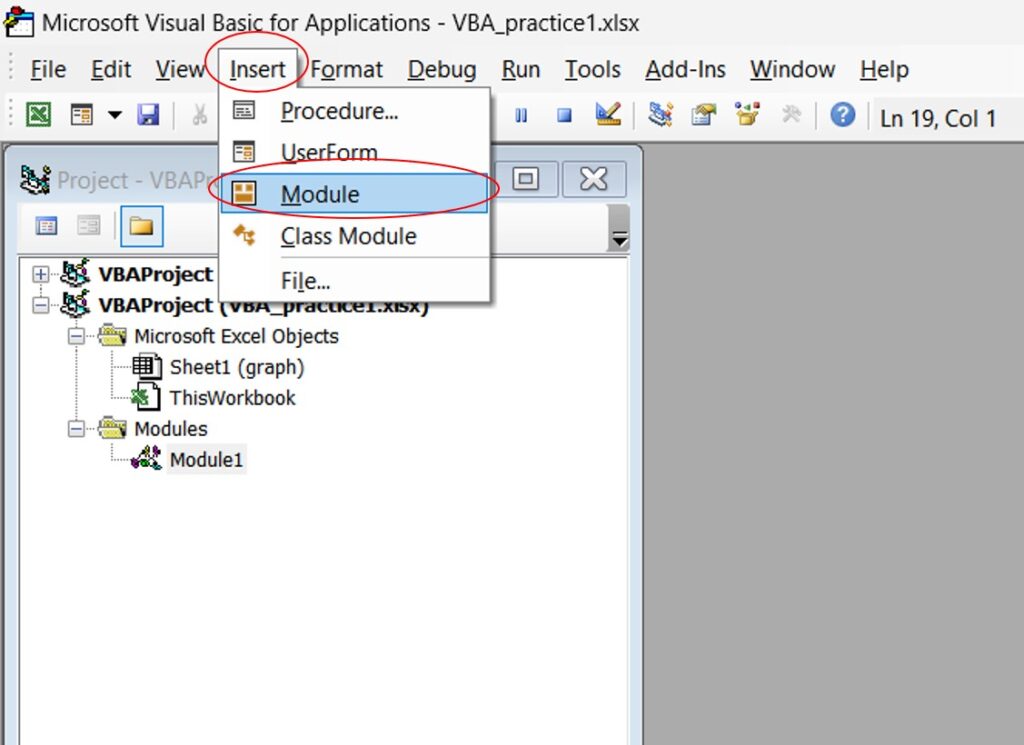
Then, write the below codes in the Module window.
<mark style="background-color:rgba(0, 0, 0, 0)" class="has-inline-color has-vivid-cyan-blue-color">Sub</mark> sample01 ()
<mark style="background-color:rgba(0, 0, 0, 0)" class="has-inline-color has-vivid-cyan-blue-color">Dim</mark> xytitle <mark style="background-color:rgba(0, 0, 0, 0)" class="has-inline-color has-vivid-cyan-blue-color">As</mark> chart
<mark style="background-color:rgba(0, 0, 0, 0)" class="has-inline-color has-vivid-cyan-blue-color">Set</mark> xytitle = Worksheets("graph").ChartObjects(1).chart
<mark style="background-color:rgba(0, 0, 0, 0)" class="has-inline-color has-vivid-cyan-blue-color">With</mark> xytitle.axes(xlCategory)
   .HasTitle = <mark style="background-color:rgba(0, 0, 0, 0)" class="has-inline-color has-vivid-cyan-blue-color">True</mark>
   .AxisTitle.Text = "Genotype"
   .AxisTitle.Font.Size = 16
   .AxisTitle.Font.Bold = <mark style="background-color:rgba(0, 0, 0, 0)" class="has-inline-color has-vivid-cyan-blue-color">False</mark>
<mark style="background-color:rgba(0, 0, 0, 0)" class="has-inline-color has-vivid-cyan-blue-color">End With</mark>
<mark style="background-color:rgba(0, 0, 0, 0)" class="has-inline-color has-vivid-cyan-blue-color">With</mark> xytitle.axes(xlValue)
   .HasTitle = <mark style="background-color:rgba(0, 0, 0, 0)" class="has-inline-color has-vivid-cyan-blue-color">True</mark>
   .AxisTitle.Text = "Yield(kh/ha)"
   .MaximumScale = 150
   .MajorUnit = 30
   .AxisTitle.Font.Size = 16
   .AxisTitle.Font.Bold = <mark style="background-color:rgba(0, 0, 0, 0)" class="has-inline-color has-vivid-cyan-blue-color">False</mark>
<mark style="background-color:rgba(0, 0, 0, 0)" class="has-inline-color has-vivid-cyan-blue-color">End With
End Sub</mark>

Remember!! The blue color text should be shown (activated). Otherwise, The codes do not work.
Then, press F5 to run the code.
Now, you can see the first graph was changed. Let’s go through what the VBA codes mean.
<mark style="background-color:rgba(0, 0, 0, 0)" class="has-inline-color has-vivid-cyan-blue-color">Sub</mark> sample01 ()
→ <mark style="background-color:rgba(0, 0, 0, 0)" class="has-inline-color has-vivid-red-color">This is the basic construction of VBA code. This code name is sample 01</mark>
<mark style="background-color:rgba(0, 0, 0, 0)" class="has-inline-color has-vivid-cyan-blue-color">Dim</mark> xytitle <mark style="background-color:rgba(0, 0, 0, 0)" class="has-inline-color has-vivid-cyan-blue-color">As</mark> chart
→ <mark style="background-color:rgba(0, 0, 0, 0)" class="has-inline-color has-vivid-red-color">declare variable. I named variable name as xytitle, and this variable is for chart</mark>
<mark style="background-color:rgba(0, 0, 0, 0)" class="has-inline-color has-vivid-cyan-blue-color">Set</mark> xytitle = Worksheets("graph").ChartObjects(1).chart
→ <mark style="background-color:rgba(0, 0, 0, 0)" class="has-inline-color has-vivid-red-color">xytitle set up in the worksheet name; "graph", and the first graph</mark> <mark style="background-color:rgba(0, 0, 0, 0)" class="has-inline-color has-vivid-red-color">in the worksheet. For worksheet, please check your worksheet name in which graphs exist!!
</mark><mark style="background-color:rgba(0, 0, 0, 0)" class="has-inline-color has-vivid-cyan-blue-color">With</mark> xytitle.axes(xlCategory)
→ <mark style="background-color:rgba(0, 0, 0, 0)" class="has-inline-color has-vivid-red-color">about xytitle's x-axis</mark>
   .HasTitle = <mark style="background-color:rgba(0, 0, 0, 0)" class="has-inline-color has-vivid-cyan-blue-color">True</mark>
→ <mark style="background-color:rgba(0, 0, 0, 0)" class="has-inline-color has-vivid-red-color">it has a title</mark>
   .AxisTitle.Text = "Genotype"
→ <mark style="background-color:rgba(0, 0, 0, 0)" class="has-inline-color has-vivid-red-color">the title name is "Genotype"</mark>
   .AxisTitle.Font.Size = 16
→ <mark style="background-color:rgba(0, 0, 0, 0)" class="has-inline-color has-vivid-red-color">the font size of axis title is 16</mark>
   .AxisTitle.Font.Bold = <mark style="background-color:rgba(0, 0, 0, 0)" class="has-inline-color has-vivid-cyan-blue-color">False</mark>
→ <mark style="background-color:rgba(0, 0, 0, 0)" class="has-inline-color has-vivid-red-color">I'll not set up bold in title</mark>
<mark style="background-color:rgba(0, 0, 0, 0)" class="has-inline-color has-vivid-cyan-blue-color">End With</mark>
→ <mark style="background-color:rgba(0, 0, 0, 0)" class="has-inline-color has-vivid-red-color">and</mark>
<mark style="background-color:rgba(0, 0, 0, 0)" class="has-inline-color has-vivid-cyan-blue-color">With</mark> xytitle.axes(xlValue)
→ <mark style="background-color:rgba(0, 0, 0, 0)" class="has-inline-color has-vivid-red-color">about xytitle's y-axis</mark>
   .HasTitle = <mark style="background-color:rgba(0, 0, 0, 0)" class="has-inline-color has-vivid-cyan-blue-color">True</mark>
→ <mark style="background-color:rgba(0, 0, 0, 0)" class="has-inline-color has-vivid-red-color">it has a title</mark>
   .AxisTitle.Text = "Yield(kh/ha)"
→ <mark style="background-color:rgba(0, 0, 0, 0)" class="has-inline-color has-vivid-red-color">the title name is "Yield(kh/ha)"</mark>
   .MaximumScale = 150
→ <mark style="background-color:rgba(0, 0, 0, 0)" class="has-inline-color has-vivid-red-color">the maximum number is 150</mark>
   .MajorUnit = 30
→ <mark style="background-color:rgba(0, 0, 0, 0)" class="has-inline-color has-vivid-red-color">the unit is 30</mark>
   .AxisTitle.Font.Size = 16
→ <mark style="background-color:rgba(0, 0, 0, 0)" class="has-inline-color has-vivid-red-color">the font size of axis title is 16</mark>
   .AxisTitle.Font.Bold = <mark style="background-color:rgba(0, 0, 0, 0)" class="has-inline-color has-vivid-cyan-blue-color">False</mark>
→ <mark style="background-color:rgba(0, 0, 0, 0)" class="has-inline-color has-vivid-red-color">I'll not set up bold in title</mark>
<mark style="background-color:rgba(0, 0, 0, 0)" class="has-inline-color has-vivid-cyan-blue-color">End With</mark>
→ <mark style="background-color:rgba(0, 0, 0, 0)" class="has-inline-color has-vivid-red-color">and </mark><mark style="background-color:rgba(0, 0, 0, 0)" class="has-inline-color has-vivid-cyan-blue-color">
End Sub</mark>
→ <mark style="background-color:rgba(0, 0, 0, 0)" class="has-inline-color has-vivid-red-color">code end</mark>
Now, I want to apply the same axis titles and font size to the second and third graph. In the VBA code, we set up the first graph as ChartObjects(1).chart. Then, simply add ChartObjects(2).chart and ChartObjects(3).chart.
<mark style="background-color:rgba(0, 0, 0, 0)" class="has-inline-color has-vivid-cyan-blue-color">Sub</mark> sample01 ()
<mark style="background-color:rgba(0, 0, 0, 0)" class="has-inline-color has-vivid-cyan-blue-color">Dim</mark> xytitle <mark style="background-color:rgba(0, 0, 0, 0)" class="has-inline-color has-vivid-cyan-blue-color">As</mark> chart
<mark style="background-color:rgba(0, 0, 0, 0)" class="has-inline-color has-vivid-cyan-blue-color">Set</mark> xytitle = Worksheets("graph").<mark style="background-color:#fcb900" class="has-inline-color">ChartObjects(1).chart</mark>
<mark style="background-color:rgba(0, 0, 0, 0)" class="has-inline-color has-vivid-cyan-blue-color">With</mark> xytitle.axes(xlCategory)
   .HasTitle = <mark style="background-color:rgba(0, 0, 0, 0)" class="has-inline-color has-vivid-cyan-blue-color">True</mark>
   .AxisTitle.Text = "Genotype"
   .AxisTitle.Font.Size = 16
   .AxisTitle.Font.Bold = <mark style="background-color:rgba(0, 0, 0, 0)" class="has-inline-color has-vivid-cyan-blue-color">False</mark>
<mark style="background-color:rgba(0, 0, 0, 0)" class="has-inline-color has-vivid-cyan-blue-color">End With</mark>
<mark style="background-color:rgba(0, 0, 0, 0)" class="has-inline-color has-vivid-cyan-blue-color">With</mark> xytitle.axes(xlValue)
   .HasTitle = <mark style="background-color:rgba(0, 0, 0, 0)" class="has-inline-color has-vivid-cyan-blue-color">True</mark>
   .AxisTitle.Text = "Yield(kh/ha)"
   .MaximumScale = 150
   .MajorUnit = 30
   .AxisTitle.Font.Size = 16
   .AxisTitle.Font.Bold = <mark style="background-color:rgba(0, 0, 0, 0)" class="has-inline-color has-vivid-cyan-blue-color">False</mark>
<mark style="background-color:rgba(0, 0, 0, 0)" class="has-inline-color has-vivid-cyan-blue-color">End With</mark>
<mark style="background-color:rgba(0, 0, 0, 0)" class="has-inline-color has-vivid-cyan-blue-color">Set</mark> xytitle = Worksheets("graph").<mark style="background-color:#fcb900" class="has-inline-color">ChartObjects(2).chart</mark>
<mark style="background-color:rgba(0, 0, 0, 0)" class="has-inline-color has-vivid-cyan-blue-color">With</mark> xytitle.axes(xlCategory)
   .HasTitle = <mark style="background-color:rgba(0, 0, 0, 0)" class="has-inline-color has-vivid-cyan-blue-color">True</mark>
   .AxisTitle.Text = "Genotype"
   .AxisTitle.Font.Size = 16
   .AxisTitle.Font.Bold = <mark style="background-color:rgba(0, 0, 0, 0)" class="has-inline-color has-vivid-cyan-blue-color">False</mark>
<mark style="background-color:rgba(0, 0, 0, 0)" class="has-inline-color has-vivid-cyan-blue-color">End With</mark>
<mark style="background-color:rgba(0, 0, 0, 0)" class="has-inline-color has-vivid-cyan-blue-color">With</mark> xytitle.axes(xlValue)
   .HasTitle = <mark style="background-color:rgba(0, 0, 0, 0)" class="has-inline-color has-vivid-cyan-blue-color">True</mark>
   .AxisTitle.Text = "Yield(kh/ha)"
   .MaximumScale = 150
   .MajorUnit = 30
   .AxisTitle.Font.Size = 16
   .AxisTitle.Font.Bold = <mark style="background-color:rgba(0, 0, 0, 0)" class="has-inline-color has-vivid-cyan-blue-color">False</mark>
<mark style="background-color:rgba(0, 0, 0, 0)" class="has-inline-color has-vivid-cyan-blue-color">End With</mark>
<mark style="background-color:rgba(0, 0, 0, 0)" class="has-inline-color has-vivid-cyan-blue-color">Set</mark> xytitle = Worksheets("graph").<mark style="background-color:#fcb900" class="has-inline-color">ChartObjects(3).chart</mark>
<mark style="background-color:rgba(0, 0, 0, 0)" class="has-inline-color has-vivid-cyan-blue-color">With</mark> xytitle.axes(xlCategory)
   .HasTitle = <mark style="background-color:rgba(0, 0, 0, 0)" class="has-inline-color has-vivid-cyan-blue-color">True</mark>
   .AxisTitle.Text = "Genotype"
   .AxisTitle.Font.Size = 16
   .AxisTitle.Font.Bold = <mark style="background-color:rgba(0, 0, 0, 0)" class="has-inline-color has-vivid-cyan-blue-color">False</mark>
<mark style="background-color:rgba(0, 0, 0, 0)" class="has-inline-color has-vivid-cyan-blue-color">End With</mark>
<mark style="background-color:rgba(0, 0, 0, 0)" class="has-inline-color has-vivid-cyan-blue-color">With</mark> xytitle.axes(xlValue)
   .HasTitle = <mark style="background-color:rgba(0, 0, 0, 0)" class="has-inline-color has-vivid-cyan-blue-color">True</mark>
   .AxisTitle.Text = "Yield(kh/ha)"
   .MaximumScale = 150
   .MajorUnit = 30
   .AxisTitle.Font.Size = 16
   .AxisTitle.Font.Bold = <mark style="background-color:rgba(0, 0, 0, 0)" class="has-inline-color has-vivid-cyan-blue-color">False</mark>
<mark style="background-color:rgba(0, 0, 0, 0)" class="has-inline-color has-vivid-cyan-blue-color">End With
End Sub</mark>

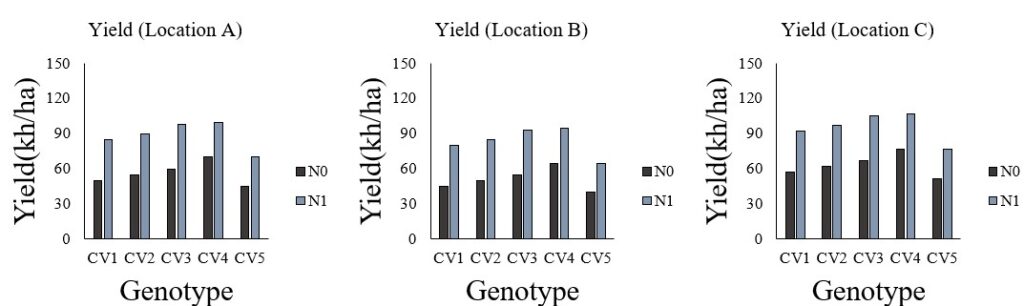
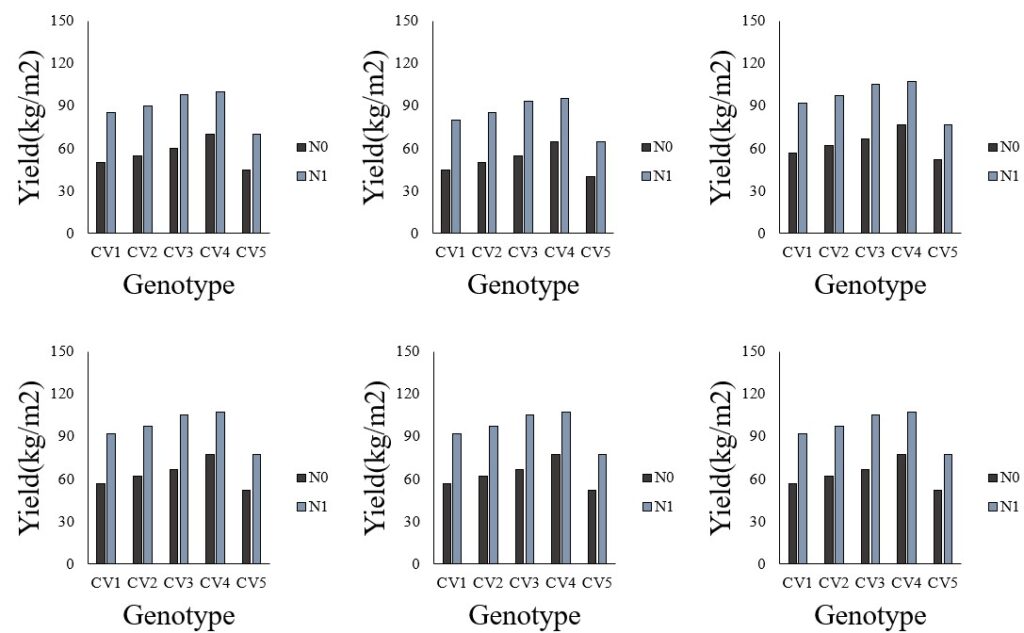
Automatically all graphs were changed with the same x-y title, and the range and unit in y-axis.
For… Next code
How about there are 100 graph? Do we have to copy and paste the same code 100 times? Again!! We don’t have time to do such useless things. In this case, if we use For... Next code, we can quickly change graphs at a time.
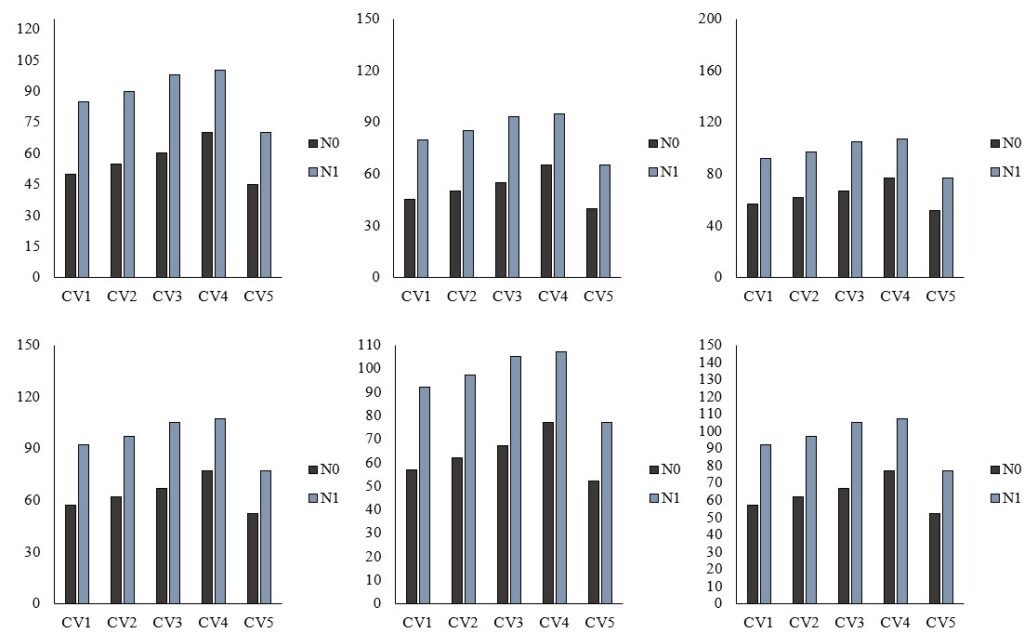
For example, now I have 6 graphs, and I want to add the same x-y title and adjust the same range and unit in y-axis.
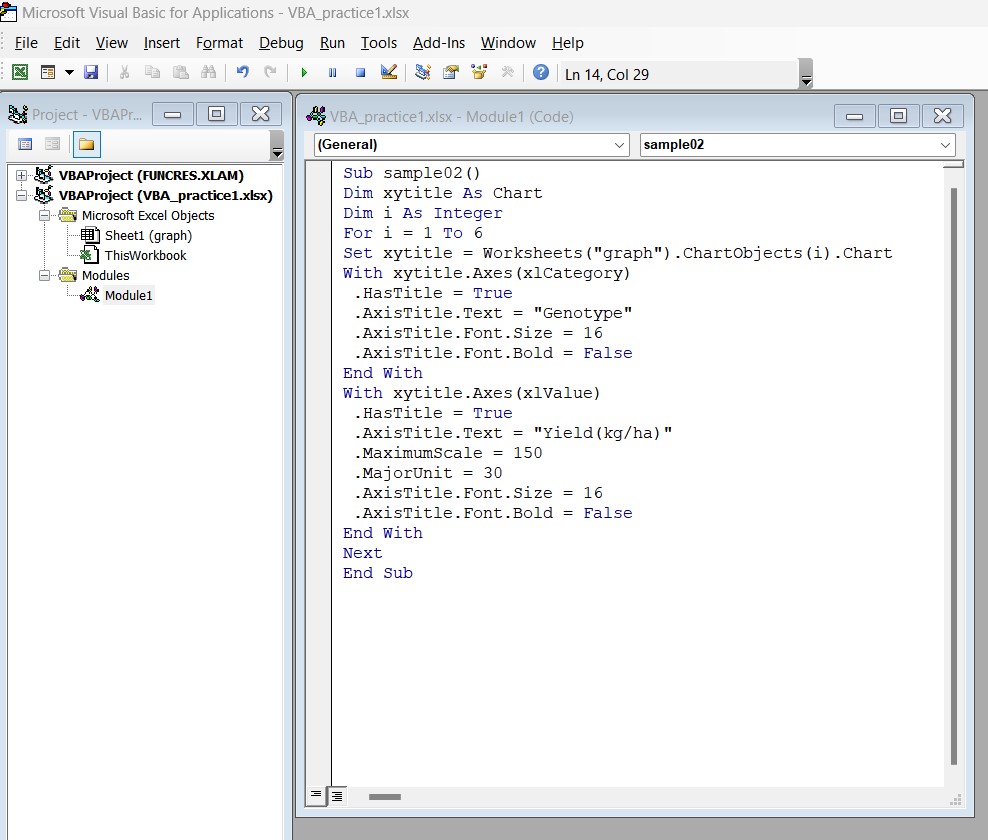
Here is a new code.
<mark style="background-color:rgba(0, 0, 0, 0)" class="has-inline-color has-vivid-cyan-blue-color">Sub</mark> sample02 ()
<mark style="background-color:rgba(0, 0, 0, 0)" class="has-inline-color has-vivid-cyan-blue-color">Dim</mark> xytile <mark style="background-color:rgba(0, 0, 0, 0)" class="has-inline-color has-vivid-cyan-blue-color">As</mark> Chart
<mark style="background-color:rgba(0, 0, 0, 0)" class="has-inline-color has-vivid-cyan-blue-color">Dim</mark> i <mark style="background-color:rgba(0, 0, 0, 0)" class="has-inline-color has-vivid-cyan-blue-color">As Integer  </mark>
<mark style="background-color:rgba(0, 0, 0, 0)" class="has-inline-color has-vivid-cyan-blue-color">For</mark> i = 1 <mark style="background-color:rgba(0, 0, 0, 0)" class="has-inline-color has-vivid-cyan-blue-color">To</mark> 6
<mark style="background-color:rgba(0, 0, 0, 0)" class="has-inline-color has-vivid-cyan-blue-color">Set</mark> xytitle = Worksheets("graph").ChartObjects(i).Chart
<mark style="background-color:rgba(0, 0, 0, 0)" class="has-inline-color has-vivid-cyan-blue-color">With</mark> xytitle.Axes(xlCategory)
 .HasTitle = <mark style="background-color:rgba(0, 0, 0, 0)" class="has-inline-color has-vivid-cyan-blue-color">True</mark>
 .AxisTitle.Text = "Genoytpe"
 .AxisTitle.Font.Size = 16
 .AxisTitle.Font.Bold = <mark style="background-color:rgba(0, 0, 0, 0)" class="has-inline-color has-vivid-cyan-blue-color">False </mark>
<mark style="background-color:rgba(0, 0, 0, 0)" class="has-inline-color has-vivid-cyan-blue-color">End With</mark>
<mark style="background-color:rgba(0, 0, 0, 0)" class="has-inline-color has-vivid-cyan-blue-color">With</mark> xytitle.Axes(xlValue)
 .HasTitle = <mark style="background-color:rgba(0, 0, 0, 0)" class="has-inline-color has-vivid-cyan-blue-color">True</mark>
 .AxisTitle.Text = "Yield(kg/ha)"
 .MaximumScale = 150
 .MajorUnit = 30
 .AxisTitle.Font.Size = 16
 .AxisTitle.Font.Bold = <mark style="background-color:rgba(0, 0, 0, 0)" class="has-inline-color has-vivid-cyan-blue-color">False</mark>
<mark style="background-color:rgba(0, 0, 0, 0)" class="has-inline-color has-vivid-cyan-blue-color">End With
Next
End Sub</mark>
All graphs were changed at a time.
All of sudden, we realized that yield was not kg/ha, but kg/m2. So, we need to change the title of y-axis in all graphs, but we already made up the code, so simply we can change the title name of y-axis.
<mark style="background-color:rgba(0, 0, 0, 0)" class="has-inline-color has-vivid-cyan-blue-color">Sub</mark> sample02 ()
<mark style="background-color:rgba(0, 0, 0, 0)" class="has-inline-color has-vivid-cyan-blue-color">Dim</mark> xytile <mark style="background-color:rgba(0, 0, 0, 0)" class="has-inline-color has-vivid-cyan-blue-color">As</mark> Chart
<mark style="background-color:rgba(0, 0, 0, 0)" class="has-inline-color has-vivid-cyan-blue-color">Dim</mark> i <mark style="background-color:rgba(0, 0, 0, 0)" class="has-inline-color has-vivid-cyan-blue-color">As Integer  </mark>
<mark style="background-color:rgba(0, 0, 0, 0)" class="has-inline-color has-vivid-cyan-blue-color">For</mark> i = 1 <mark style="background-color:rgba(0, 0, 0, 0)" class="has-inline-color has-vivid-cyan-blue-color">To</mark> 6
<mark style="background-color:rgba(0, 0, 0, 0)" class="has-inline-color has-vivid-cyan-blue-color">Set</mark> xytitle = Worksheets("graph").ChartObjects(i).Chart
<mark style="background-color:rgba(0, 0, 0, 0)" class="has-inline-color has-vivid-cyan-blue-color">With</mark> xytitle.Axes(xlCategory)
 .HasTitle = <mark style="background-color:rgba(0, 0, 0, 0)" class="has-inline-color has-vivid-cyan-blue-color">True</mark>
 .AxisTitle.Text = "Genoytpe"
 .AxisTitle.Font.Size = 16
 .AxisTitle.Font.Bold = <mark style="background-color:rgba(0, 0, 0, 0)" class="has-inline-color has-vivid-cyan-blue-color">False </mark>
<mark style="background-color:rgba(0, 0, 0, 0)" class="has-inline-color has-vivid-cyan-blue-color">End With</mark>
<mark style="background-color:rgba(0, 0, 0, 0)" class="has-inline-color has-vivid-cyan-blue-color">With</mark> xytitle.Axes(xlValue)
 .HasTitle = <mark style="background-color:rgba(0, 0, 0, 0)" class="has-inline-color has-vivid-cyan-blue-color">True</mark>
 .AxisTitle.Text = "<mark style="background-color:#fcb900" class="has-inline-color">Yield(kg/m2)</mark>"
 .MaximumScale = 0.15
 .MajorUnit = 0.03
 .AxisTitle.Font.Size = 16
 .AxisTitle.Font.Bold = <mark style="background-color:rgba(0, 0, 0, 0)" class="has-inline-color has-vivid-cyan-blue-color">False</mark>
<mark style="background-color:rgba(0, 0, 0, 0)" class="has-inline-color has-vivid-cyan-blue-color">End With
Next
End Sub</mark>
When we run above code, all graphs were changed at a time.